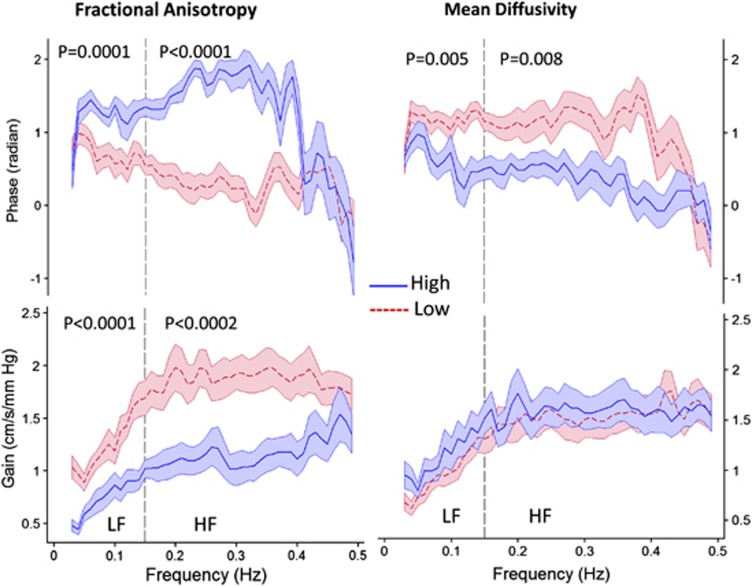
Figure 2.
Relationship between dynamic cerebral autoregulation and fractional anisotropy (FA) and mean diffusivity (MD) in normal-appearing white matter. Transfer function phase and gain are plotted across the frequency spectrum of 0 to 0.5 Hz in subjects with low and high (divided at the median) fractional anisotropy (FA, median=0.395, range=0.319 to 0.478) and mean diffusivity (MD, median=0.814, range=0.716 to 1.061) in regions of normal-appearing white matter. Solid blue and dashed red lines indicate mean phase and gain across the frequency range for high and low FA and MD, respectively, and the shaded regions are standard error of the mean (s.e.m.). Low FA and high MD represent lower white matter structural integrity and lower phase and higher gain values indicate less effective dynamic cerebral autoregulation.

