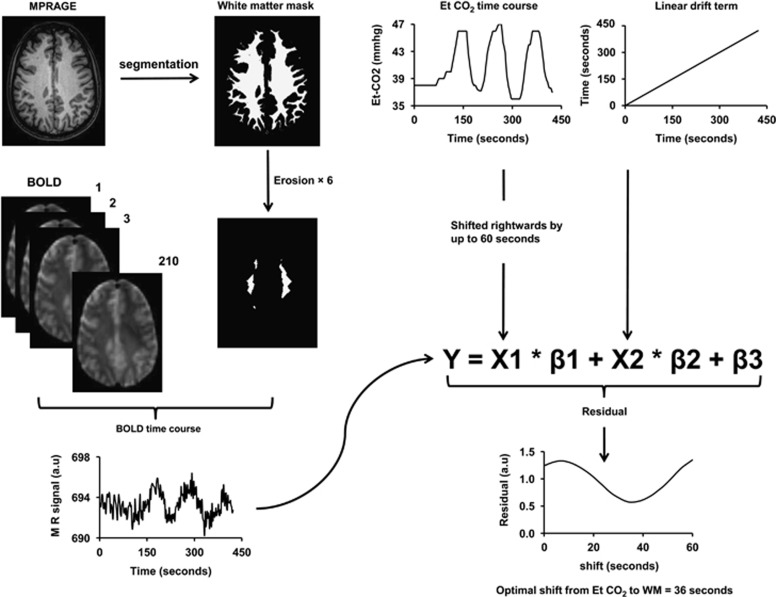
Figure 1.
Illustration of analysis steps for the quantification of white matter (WM) cerebrovascular reactivity (CVR) and delay time. Upper left: Magnetization-Prepared-Rapid-Acquisition-of-Gradient-Echo (MPRAGE) T1-weighted image is segmented using SPM5 to obtain a mask of WM (voxels with >90% WM probability). To further reduce the likelihood of gray matter (GM) partial volume, the mask is eroded three-dimensionally by six times. Thus, the final mask is considerably small, but is expected to contain minimal GM contribution. The final mask is then applied on the blood-oxygenation-level-dependent (BOLD) image series to obtain a BOLD time course in the WM, which is used as the dependent variable in the linear regression analysis. Upper right: End-tidal (Et) CO2 time course and a linear drift term are used as independent variables in the linear regression analysis. To identify the optimal delay time, the Et CO2 curve is shifted rightwards by 0 to 60 seconds at an interval of the acquisition repetition time (TR) (2.0 seconds). At each shift, the linear regression analysis was performed and a residual error term is calculated. The optimal delay time is then determined based on the shift that yields the least residual error.

