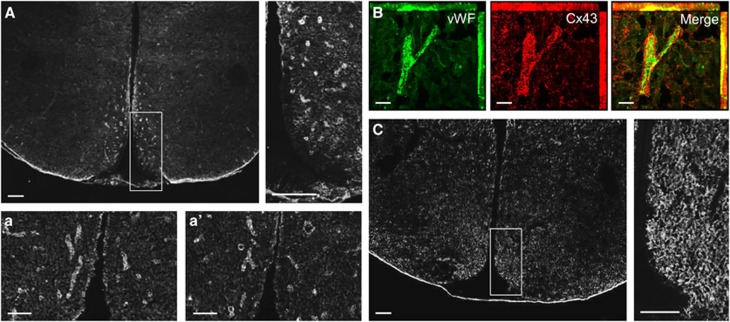
Figure 2.
Hypothalamic Cx43 and Cx30 distribution. (A) Cx43 immunostaining in the hypothalamus and observations at higher magnification of the mediobasal area. Scale bar, 200 μm. (a, a′) Cx43 immunostaining in the mediobasal hypothalamus. Scale bar, 50 μm. (B) Double immunohistochemistry representing endothelial staining with von Willebrand Factor (in green, left panel), Cx43 staining (in red, central panel), and merged images (right panel). Scale bar, 20 μm. (C) Cx30 immunostaining in the hypothalamus and observations at higher magnification of the mediobasal area. Scale bar, 200 μm.

