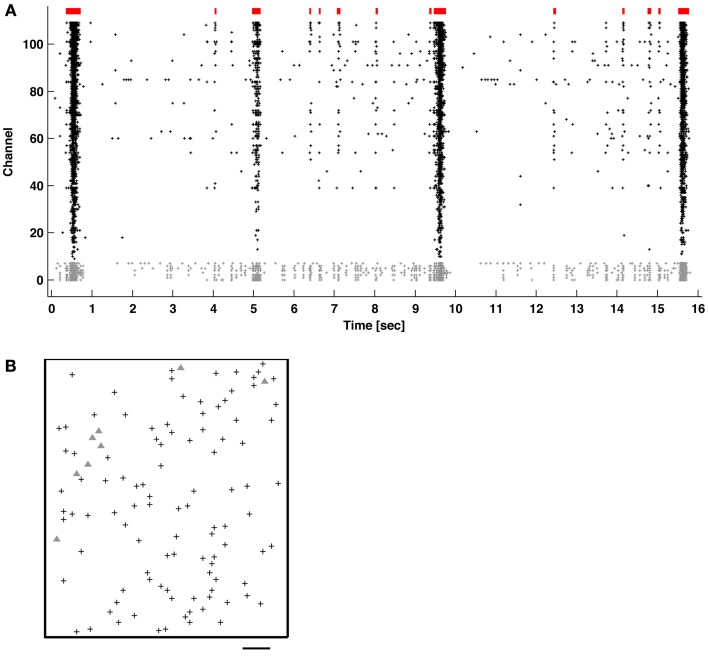
Figure 1.
(A) Network bursts (indicated in red) of varying durations of coincidental APs (raster dots) recorded across multiple channels. The majority of neurons mainly fired together within network bursts (columns of dots), but some also fired “tonically” outside of bursts (channels with gray dots). (B) Locations of the recording electrodes selected in the CMOS-based MEA (see Methods). Gray triangles correspond to the channels with gray dots in (A). Scale bar: 200 μm.

