Figure 2.
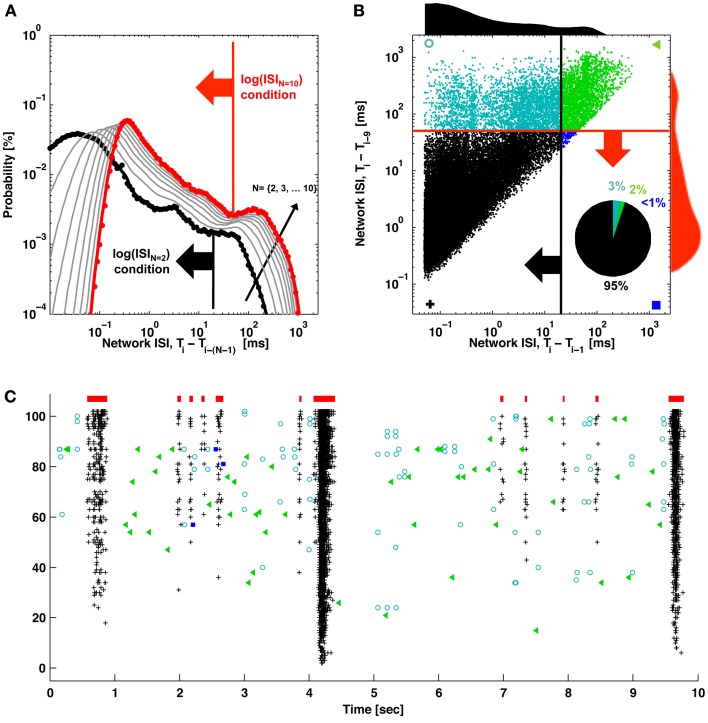
ISIN thresholds and burst detection. (A) The probability of elapsed times between consecutive spikes (black; ISI) and every Nth spike (gray) up to every 10th spike (red) are plotted. Elevated firing during network bursting corresponds to lower ISI, and the red arrow indicates the threshold for burst detection used in Figure 1. (B) The elapsed time between consecutive spikes is plotted vs. the elapsed time between every 10 spikes. Histograms correspond to the black and red probability distributions in (A), and the red and black arrows correspond to the ISI and ISIN thresholds in (A). For (A) and (B), ISIs were jittered by a random value between zero and one sample (50 μs) in order to better visualize the contribution from low ISIs. These would otherwise be plotted on top of each other in discrete lines corresponding to multiples of the sampling rate. The inset pie chart shows the percentage of spikes in each quadrant. Symbols match the spike markers in (C). (C) Detector performance for a segment of network activity. Black pluses and blue squares indicate spikes that would be classified in bursts (red bars) using an ISIN = 10 threshold. Black pluses and cyan circles indicate spikes that would be classified in bursts according to an ISIN = 2 threshold. Green triangles indicate spikes outside of bursts for either case.

