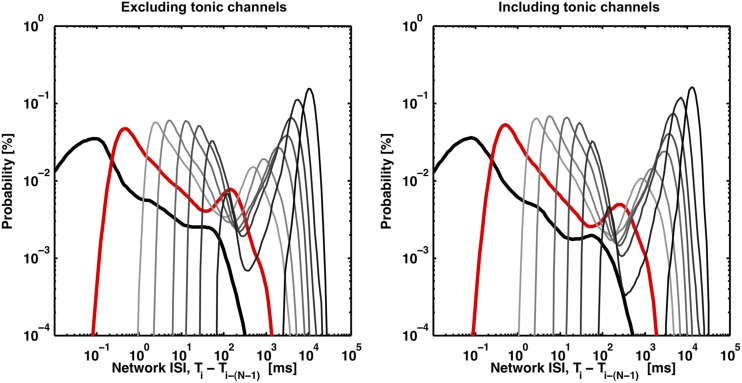
Figure 4.
Valleys in the bimodal ISIN probability distributions deepen with increasing N (light gray to dark gray) or with the inclusion of channels exhibiting tonic spiking (right panel). The distributions (black, red, light gray to dark gray) correspond to N equal to 2, 10, 50, 100, 250, 500, 1000, 2000, and 4000. The first peak disappears as N, the minimum burst size threshold, approaches the maximum burst size (~4000 spikes), which represents the trivial case of no spikes being within a burst. 8 out of 102 channels were identified as tonic according to the method presented in Figure 5. The inclusion of tonic channels can improve valley identification with a tradeoff of increased risk of identifying consecutive bursts as a single burst.

