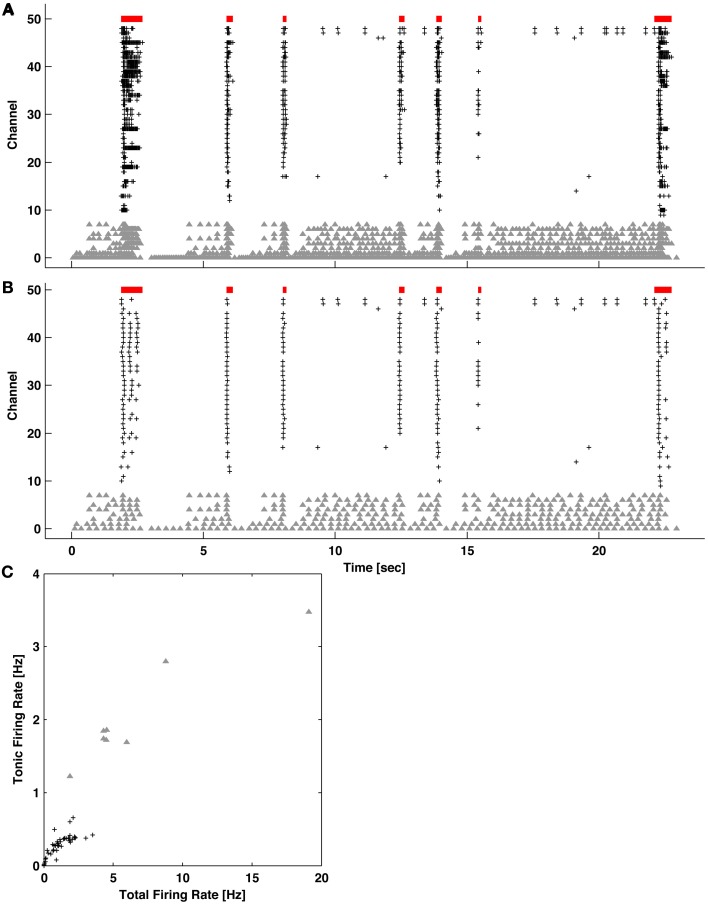
Figure 5.
Quantifying levels of tonic activity. (A) Example network activity exhibiting bursting (red bars) and channels with high levels of tonic spiking (gray triangles). Spikes on all other active channels are indicated by black pluses. (B) The same network activity after introducing an artificial refractory period of 250 ms. Spikes during bursting became preferentially removed. (C) For each channel, the tonic (from B) vs. total (from A) firing rate is plotted. Channels with elevated tonic firing (gray triangles) match visual observations in (A) and (B).

