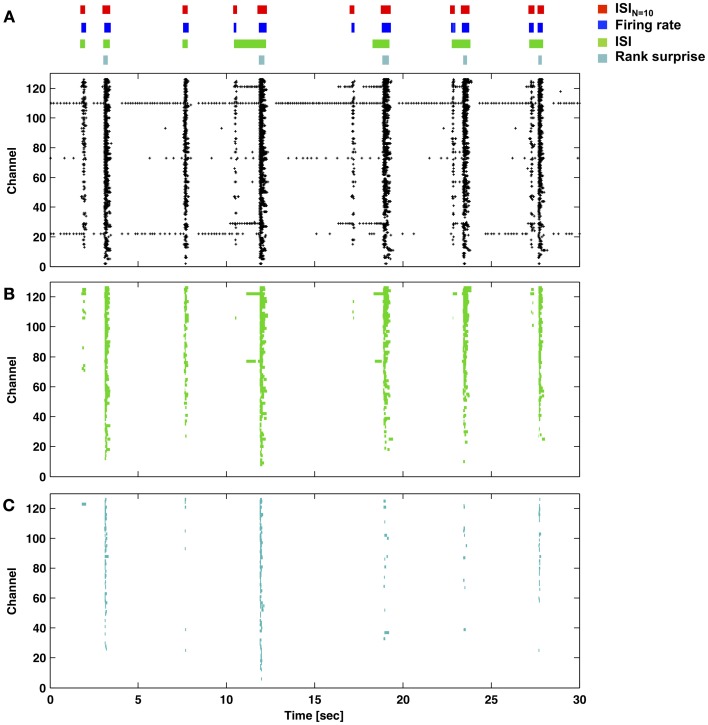
Figure 6.
Performance of the ISIN = 10-threshold detector compared to example rate-threshold, ISI-threshold, and Rank Surprise detectors. (A) Burst times and durations for each detector (color bars and legend) applied to the network activity presented in the raster plot (each marker is one spike). The ISIN = 10-threshold and rate-threshold detectors were performed directly on the network spike train. The ISI-threshold and Rank Surprise detectors were performed on single-channel spike trains in a first stage. The respective single-channel burst events in (B) and (C) were then combined in a second stage to identify network bursts as described in the Methods.

