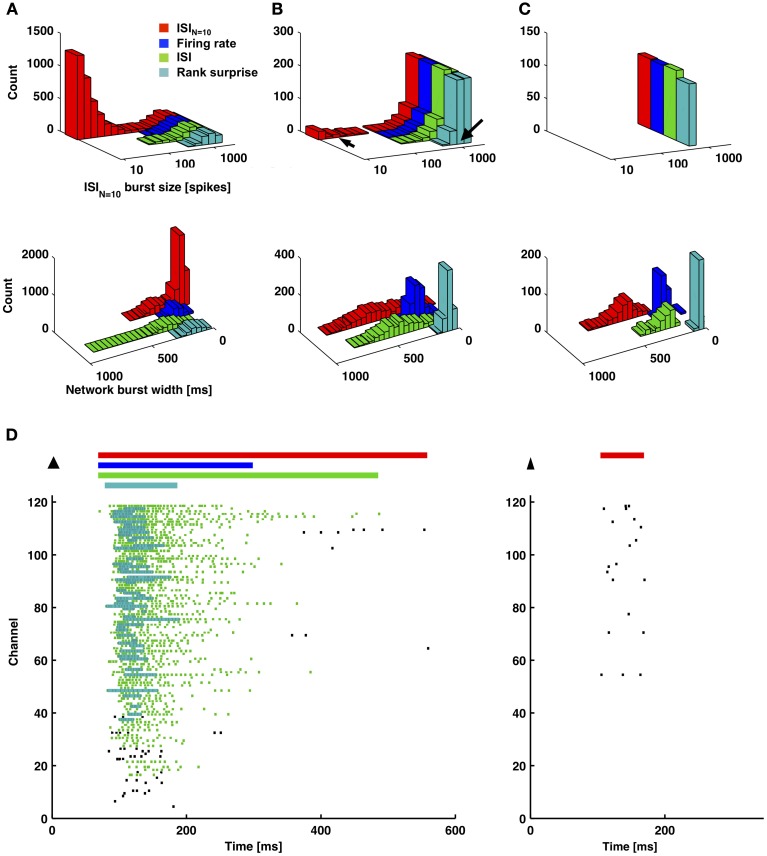
Figure 7.
An ISIN = 10-threshold detector identified small-sized bursts, and measured burst durations were shorter for a firing-rate-threshold or a rank surprise detector. (A–C) Each method was applied to 1-h long recordings from 3 cultures that each had different amounts of small bursts. The percentage of small bursts out of the total number of bursts, according to the ISIN = 10-threshold detector, were 80, 12, and 0% for (A–C), respectively. Each detector identified the largest bursts, and the ISIN = 10-threshold detector identified smaller bursts (left column). Since different detectors assign different durations to the same burst, one detector (ISIN = 10) was chosen as a reference (x-axis). In this manner, the same burst will be plotted at the same x-location, and its occurrence can be compared across detectors. Detected bursts had shorter durations for the firing-rate-threshold and rank surprise detectors. This was especially noticeable for cases with fewer short-duration small bursts in (B) and (C) (right column and D). Arrows in (B) correspond to examples of a large and a small burst in (D). (D) Plotted in (D) are durations of identified network bursts using each method (colored bars; top) and identified first-stage single-channel bursts using the ISI and Rank surprise methods (colored raster plots; each dot is a spike).

