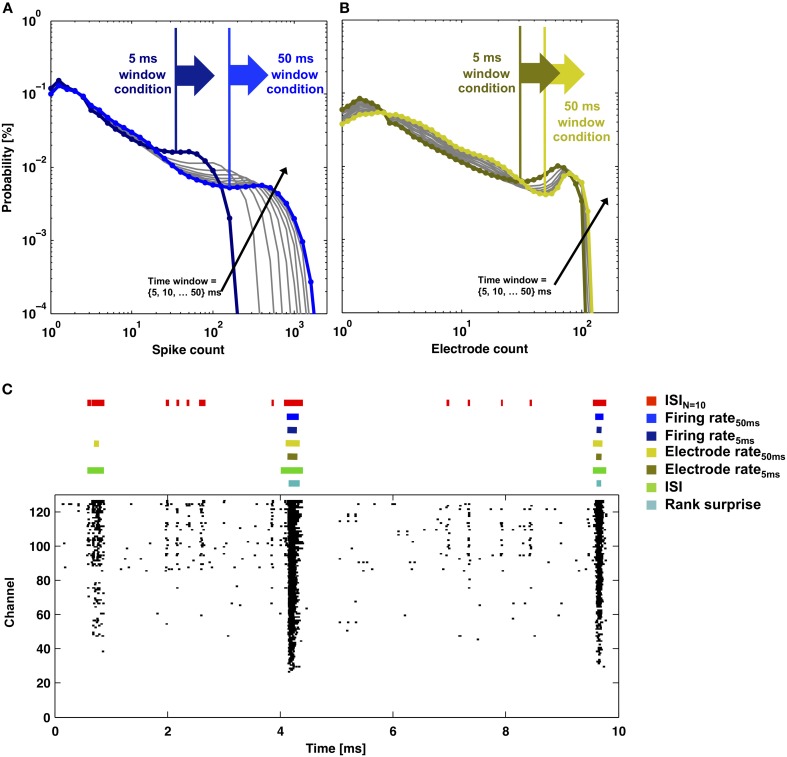
Figure 8.
Rate-thresholds and burst detection for data presented in Figure 2. The probability distributions of (A) the total number of spikes or (B) the total number of electrodes that detected a spike within a time window between 5 and 50 ms in duration (lines) are plotted. Elevated firing during network bursting corresponds to higher spike or electrode counts, and the large arrows indicate the rate-threshold for burst detection used in (C). (C) Detector performance for a segment of network activity (black dots). Colored bars indicate detected bursts for each burst detector.

