
Figure 3.
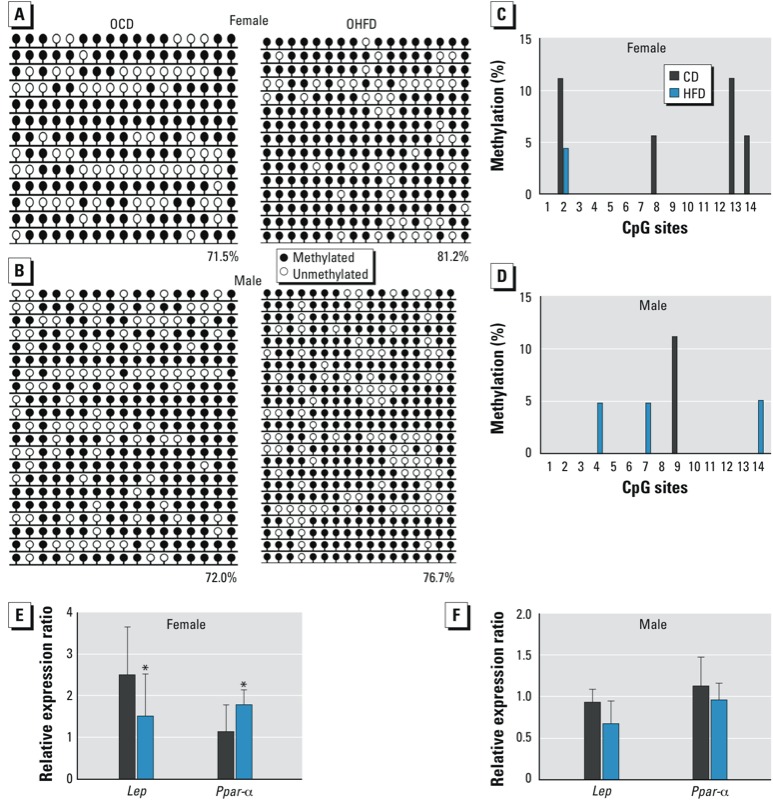
Lep and Ppar-α methylation status and gene expression in the liver of female and male OCD and OHFD mice at 7–8 weeks of age (n = 10 mice from five litters per sex per group). DNA methylation was analyzed by bisulfite sequencing, and gene expression was evaluated by qRT‑PCR. (A,B) DNA methylation of Lep in liver of female (A) and male (B) offspring. Numbers indicate the percentage of methylation; blank loci indicate lost CpG. (C,D) DNA methylation at CpG sites of Ppar-α in liver of female (C) and male (D) offspring. CpG sites are numbered 1–14. (E,F) Expression of Lep and Ppar-α in liver of female (E) and male (F) offspring. *p < 0.05.