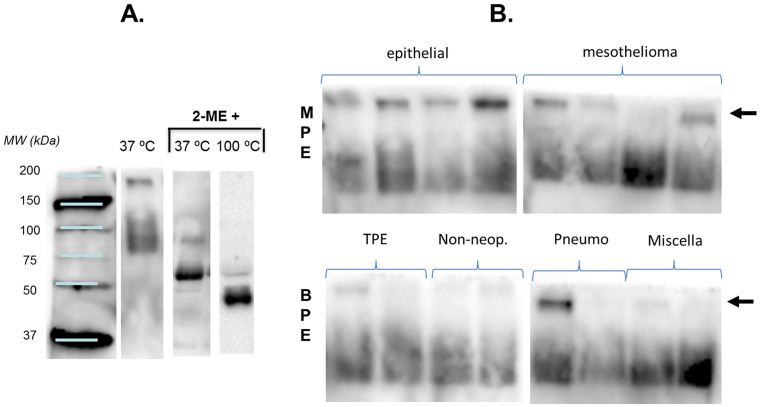
Figure 3.
(A) Western blot of PE sCD26 with anti-CD26 mAb TP1/16 according to the sample conditions used in SDS-PAGE.(B) The same western blot in samples from different pathologies showing the band of 180 kDa (arrows) mainly in MPE, which was absent or weaker in BPE samples. No clear trend was observed for the other bands of lower MW. Gel analyses were repeated 3–4 times.

