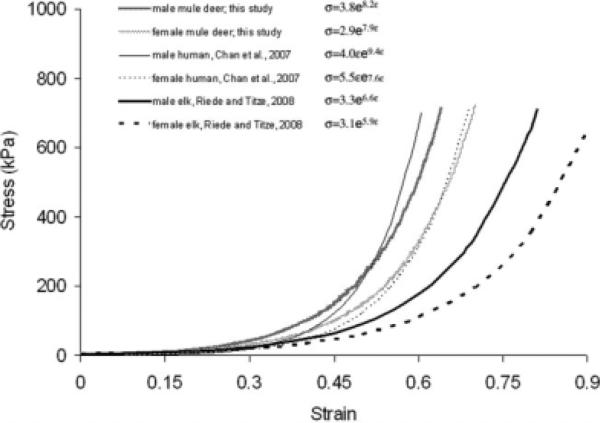
Fig. 6.
Comparative stress–strain relationship for three different species. Human data after Chan et al. (Table 4 in Chan et al. 2007); elk data from Riede and Titze (2008). Note that the exponential model used by Chan et al. is different than the one used in the elk and in this study.

