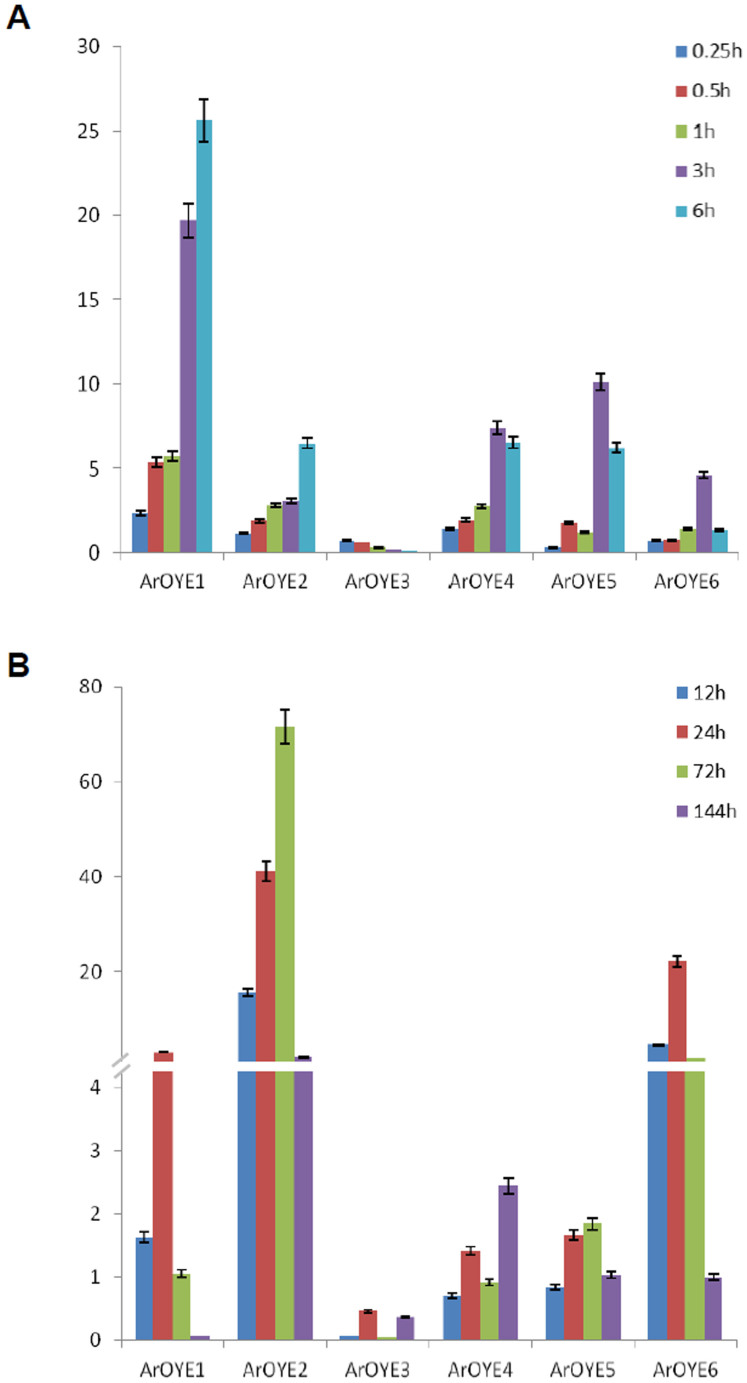
Figure 7. Expression profiles of six ArOYE genes during oxidative stress and in planta, assayed by qRT-PCR.
Bar diagrams representing the expression pattern of 6 genes are shown as the fold-change compared to the control. (A) Expression was analyzed at 0.25, 0.5, 1, 3 and 6 h after treatment with menadione. (B) Expression pattern of 6 genes from A. rabiei-infected chickpea samples are shown as fold-change compared to control. Expression was analyzed at 12, 24, 72 and 144 hours post inoculation (hpi). Error bars represent ±SE for three biological replicates. ArEF1α gene was used as an internal reference gene.

