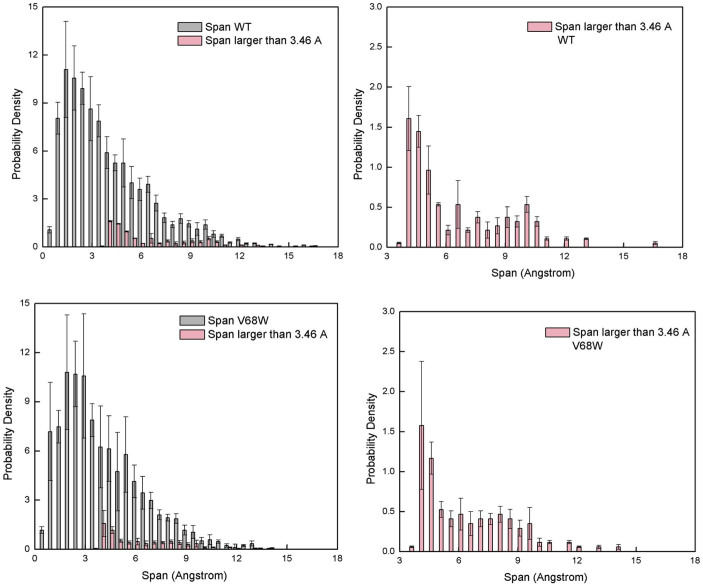
Figure 9. Span Distributions in Myoglobin and V68W mutant.
(a) Probability density of span size in Myoglobin, (b) spans size distribution with a diameter of 3.46 Å or higher (c) Same as (a) but for mutant V68W (d) Same as (b) but for mutant V68W. Error bars are estimated by dividing the trajectory into sequential segments and computing the average and standard deviation from it.

