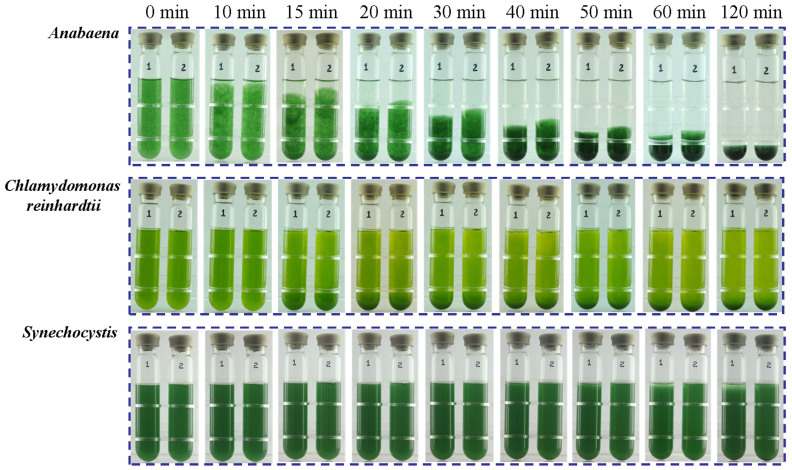
Figure 1. Compared analysis of auto-flocculation process of Anabaena, Chlamydomonas and Synechocystis.
Cells in logarithmic phase (A730 = 0.8–1.0) were equally divided into 60 mL glass tubes. Duplicate tubes of each strain were sampled for the analysis. The self-flocculation of the culture was monitored by taking photographs at the indicated time points.

