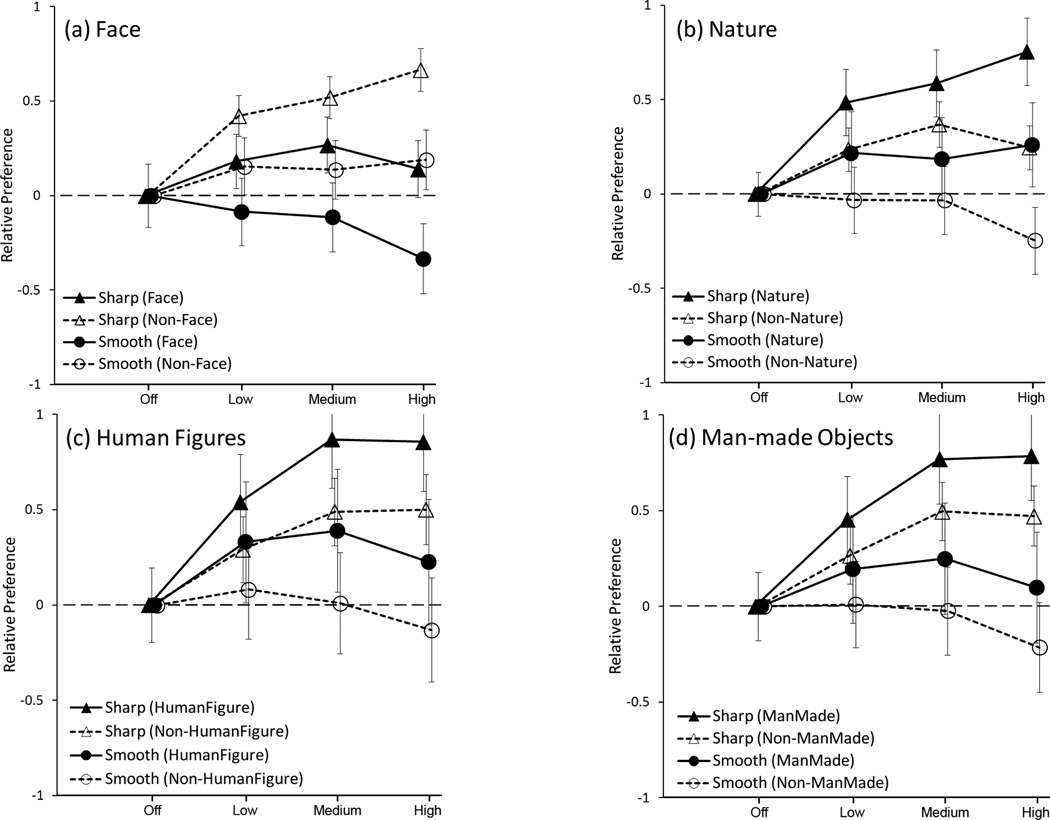
Figure 5.
Relative preferences by group (Sharp and Smooth) for high and low ratings of video-content categories (a) Faces, (b) Human figures, (c) Nature, and (d) Man-made Objects. The Face video-content category showed a response pattern that differed from the other three video-content categories, with enhancement being less preferred for high-rating (Face) video clips than for low rating (Non-Face) video clips (note the reversal of order of filled and open symbols from top to bottom). Error bars show 95% confidence intervals. To improve clarity, the group symbols are plotted with small offsets.

