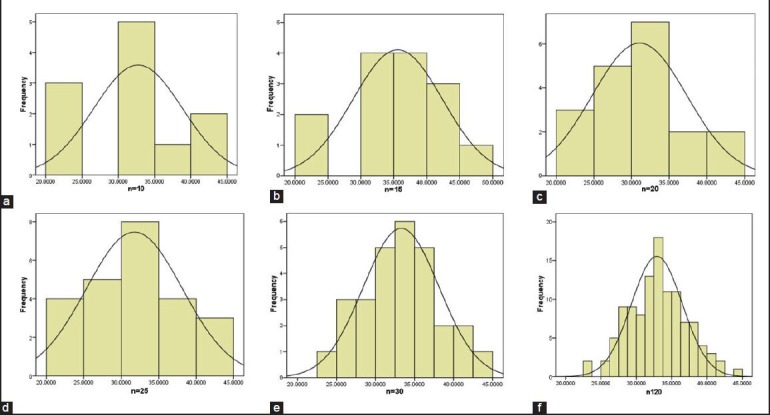
Figure 1.

Illustrates frequency distribution of shear bond strength (MPA) values at different sample size (n). (a) n = 10. (b) n = 15. (c) n = 20. (d) n = 25. (e) n = 30. (f) n = 120.
(Note: Sample size of 30 is not always an ideal number that allows normal distribution. It is observed for this data set).
