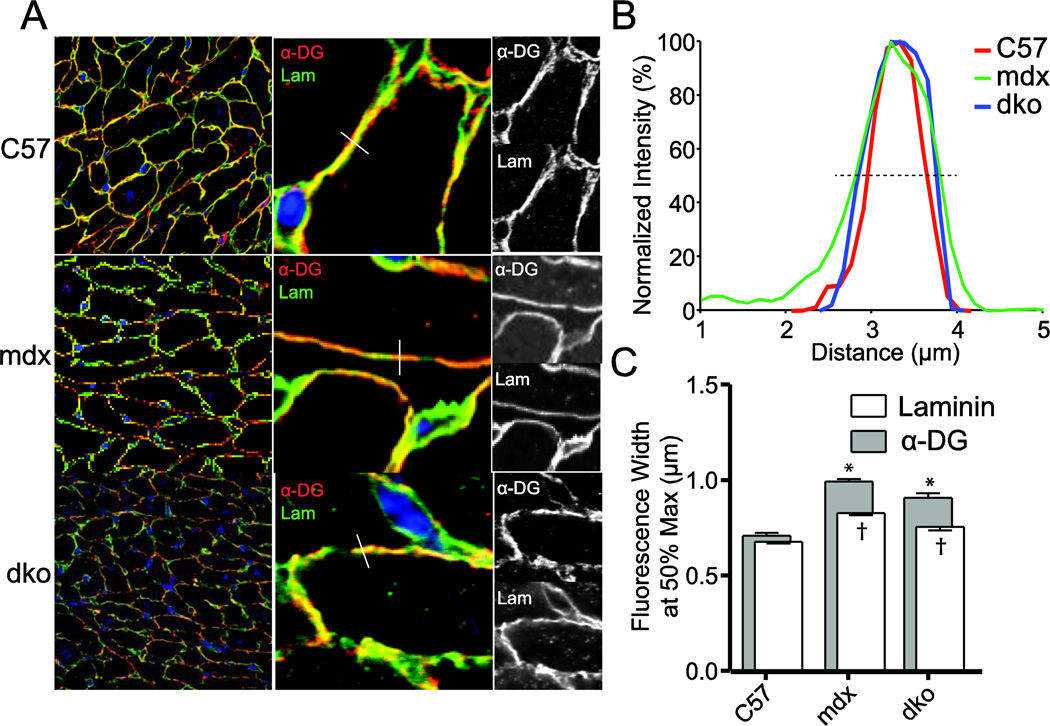
Figure 5. Line scanning of laminin and α-DG immunoreactivity.
Immunofluorescent colocalization of laminin and α-DG was measured by confocal microscopy. Line scans of membrane interfaces expressing both laminin and α-DG were collected and analyzed. (a) Representative images demonstrating example line scans. (b) Representative normalized line scans from WT, mdx, and dko sections. The dashed line represents 50%, used to calculate the distribution of immunofluorescence. (c) Summary of the distribution of immunoreactivity for laminin and α-DG. n= 419–596 individual line scans. * P<0.0001 versus WT α-DG distribution, † P< 0.0001 versus WT laminin distribution

