Figure 2.
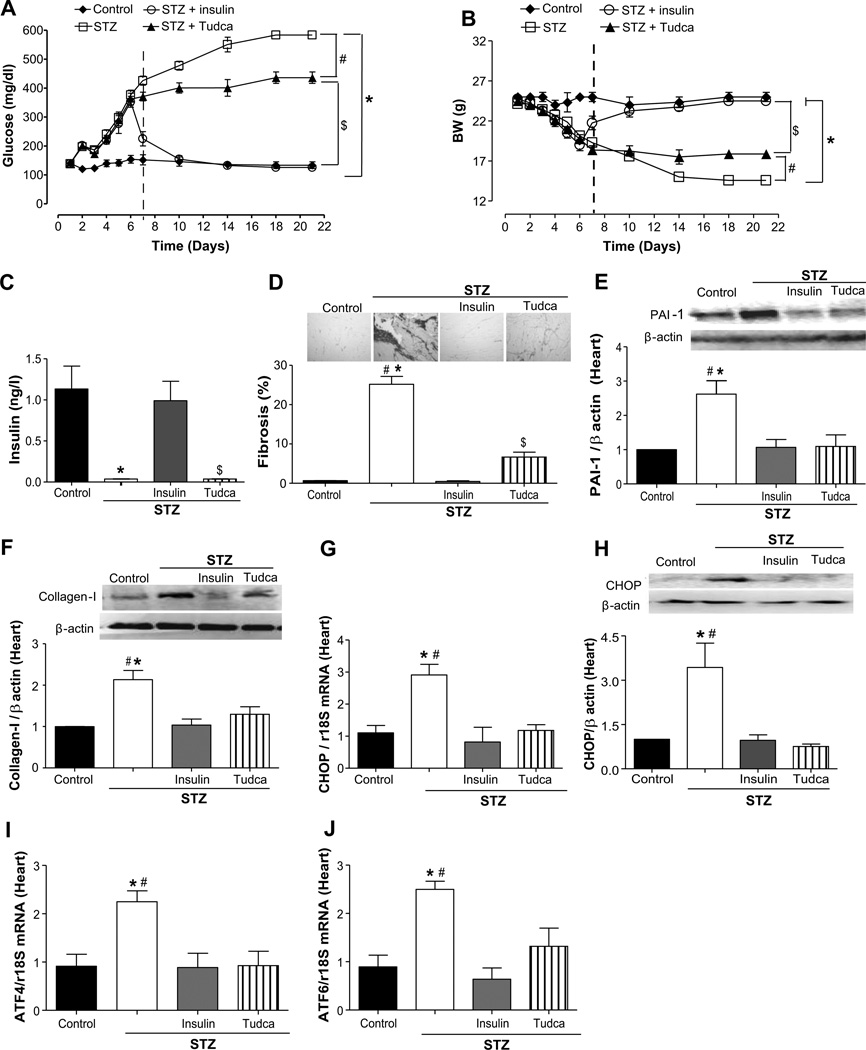
Effect of endoplasmic reticulum (ER) stress inhibition on plasma glucose, body weight, plasma insulin, cardiac fibrosis, and ER stress markers expression in heart from streptozotocin (STZ) mice. A and B, Glucose levels (mg/dL) and body weight (BW) were determined in control, STZ, STZ+insulin, and STZ+Tudca groups; n=10. The vertical dashed lines denote the start of the injection of insulin or Tudca. ◆, control; ○, STZ+insulin; □, STZ; ▲, STZ+Tudca. C, Plasma insulin levels (ng/dL) in all groups, n=10. D, Representative histological sections from the heart stained with Sirius-red, bars indicate the quantitative data, n=5. E and F, Representative Western blot analysis and quantitative data for plasminogen activator inhibitor (PAI) 1 and collagen I in heart from all of the groups, n=4 to 5. G and H, CHOP mRNA levels, n=5, and CHOP representative Western blot and quantitative data in all groups, n=3. I and J, ATF-4 and ATF-6 mRNA levels, normalized to 18S rRNA, in all groups, n=5 to 6. *P<0.05 for STZ vs control or STZ+insulin, #P<0.05 for STZ vs STZ+Tudca, $P<0.05 for STZ+Tudca vs control.

