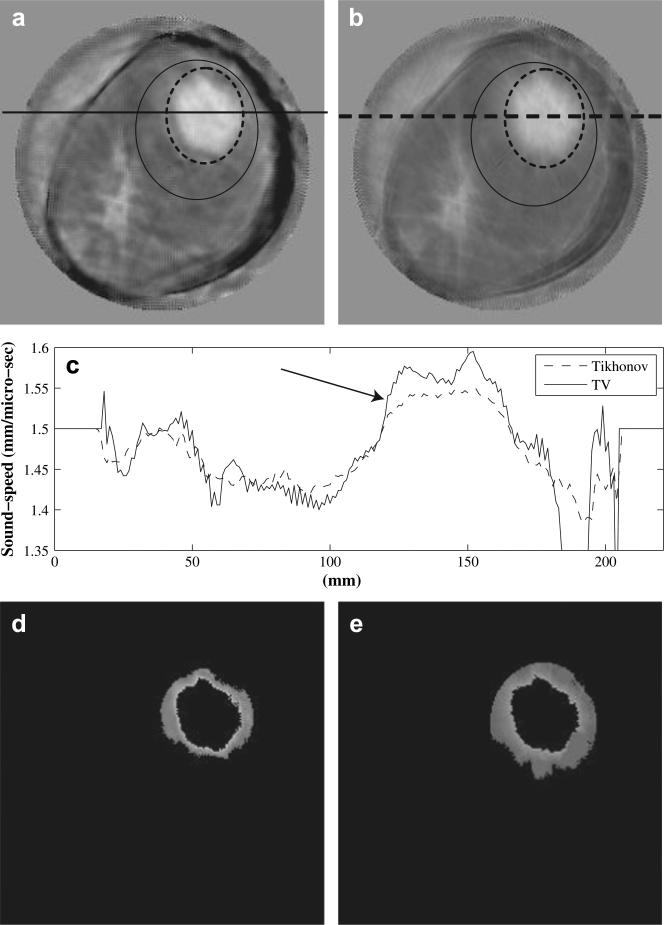
Fig. 4.
Comparison of TV (L1-norm) reconstruction in (a) with classic Tikhonov (L2-norm) reconstruction in (b). The breast has a 55 × 47 × 37 mm invasive ductal carcinoma at 12:00-1:00 o'clock. Those pixels inside the solid ellipse but outside the dashed ellipse are used to calculate the mean background sound-speed for (a) and (b),respectively. (c) Sound-speed cross-sections along the solid line in (a) and the dashed line in (b). (d) Segmented sound-speed image from (a). The left over pixels have sound-speeds high than background (1468 m/s) but lower than half power value (1530 m/s). (e) Segmented sound-speed image from (b). The left over pixels have sound-speeds high than background (1436 m/s) but lower than half power value (1501 m/s). The sound-speed scale in (a) and (b) is from 1350 m/s to 1468 m/s.

