
Figure 1-3.
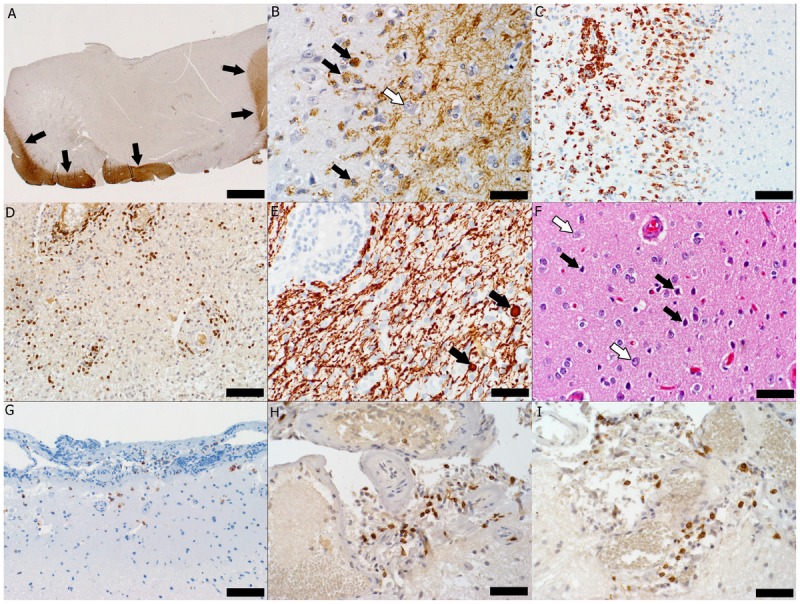
Pathology of multiple sclerosis cortical onset. A, Subpial cortical lesion visualized as the absence of proteolipid protein (PLP) immunohistochemical (IHC) staining; arrows indicate the border between the cortical lesion and the normally myelinated gray matter and white matter (PLP IHC, scale bar = 500 μm). B, Active demyelination (black arrows indicate myelin-laden macrophages) in the cortical lesion (white arrow indicates a neuron) (PLP IHC, scale bar = 50 μm). C, Macrophage infiltration (IHC for cluster of differentiation [CD] 68, a macrophage marker, scale bar = 100 μm). D, Perivascular and parenchymal infiltration with T cells visible as CD3-positive brown-stained cells (CD3 IHC, scale bar = 100 μm). E, Axonal injury evidenced by the presence of axonal swellings (arrows) in a lesional area with relative axonal preservation (IHC for neurofilament protein, scale bar = 50 μm). F, Injured neurons (black arrows) scattered among normal-appearing neurons (white arrows) (hematoxylin and eosin, scale bar = 50 μm). G, Macrophages/microglia (brown-stained cells) present in the upper cortex and meninges (CD68 IHC, scale bar = 100 μm). H, Meningeal inflammation with T lymphocytes (brown-stained cells) (CD3 IHC, scale bar = 50 μm). I, Most T cells are cytotoxic T cells as evidenced by their brown CD8 immunohistoreactivity (IHC for CD8, a marker of cytotoxic lymphocytes, scale bar = 50 μm).