
Figure 1-6.
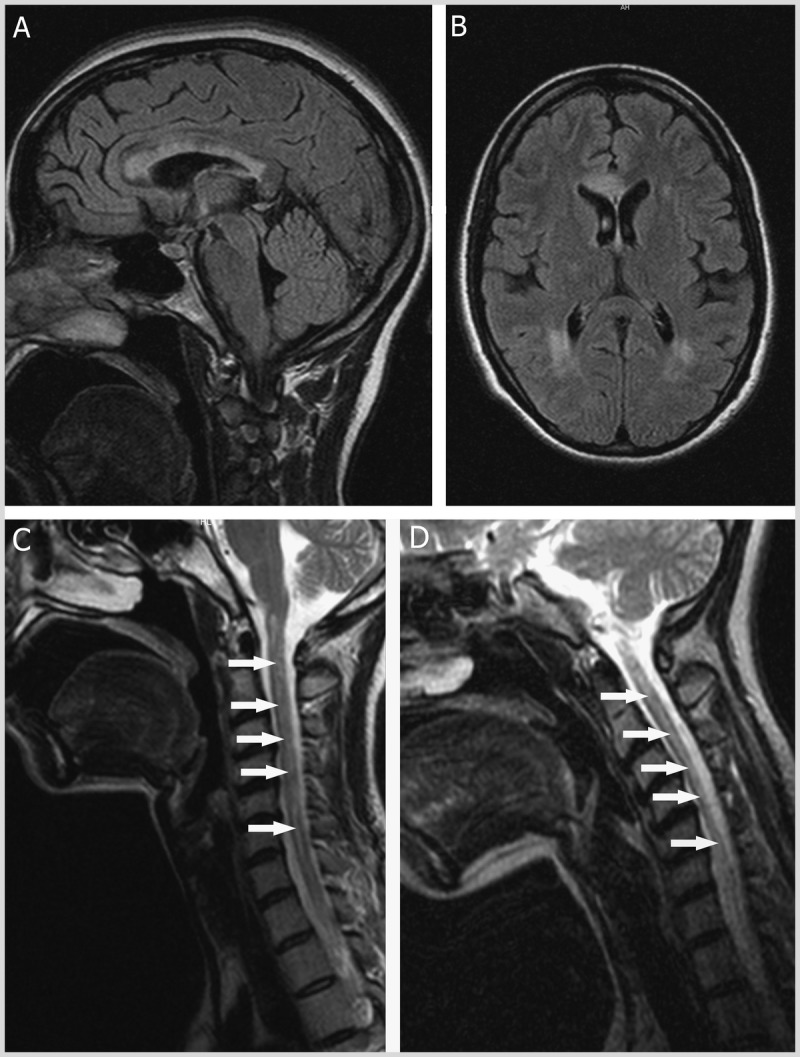
MRI of neuromyelitis optica. A, Sagittal, and B, axial fluid-attenuated inversion recovery (FLAIR) images demonstrating heterogeneous T2-hyperintense corpus callosum and periventricular lesions with poorly defined margins. C, 2 months later, and, D, 17 months later, sagittal T2-weighted images of the cervical spinal cord and posterior fossa. Note the longitudinally extensive central T2-hyperintense lesion of the spinal cord on both images (arrows). Spinal cord atrophy is appreciated as a more narrow appearance of the cord in panel D.