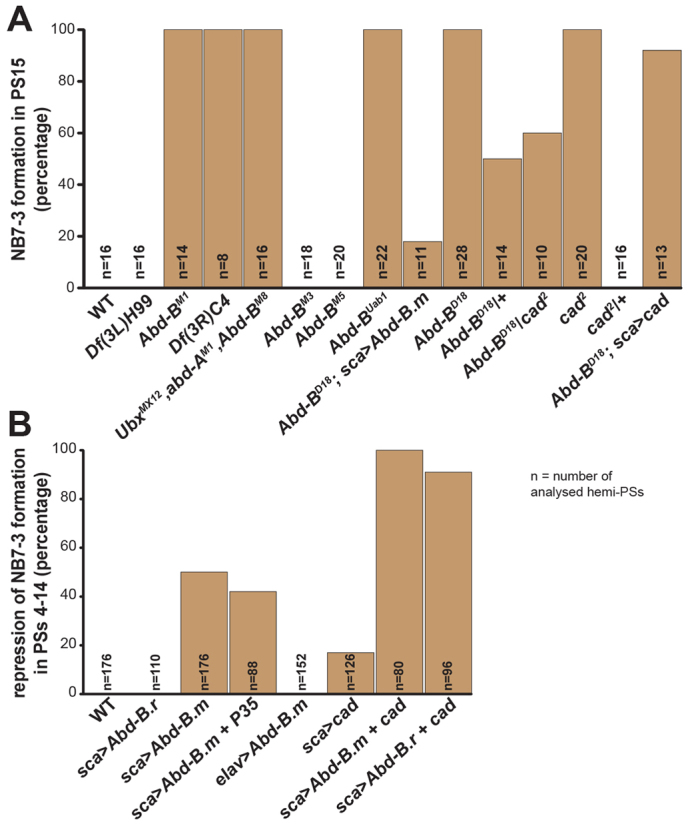
Fig. 9.

Frequencies of neuroblast 7-3 formation. Diagrams illustrating the relative frequencies of NB7-3 formation in PS15 in different mutant backgrounds (A), and the frequencies of NB7-3 suppression in PSs4-14 upon ectopic expression of different constructs (B), as indicated. WT, wild type.
