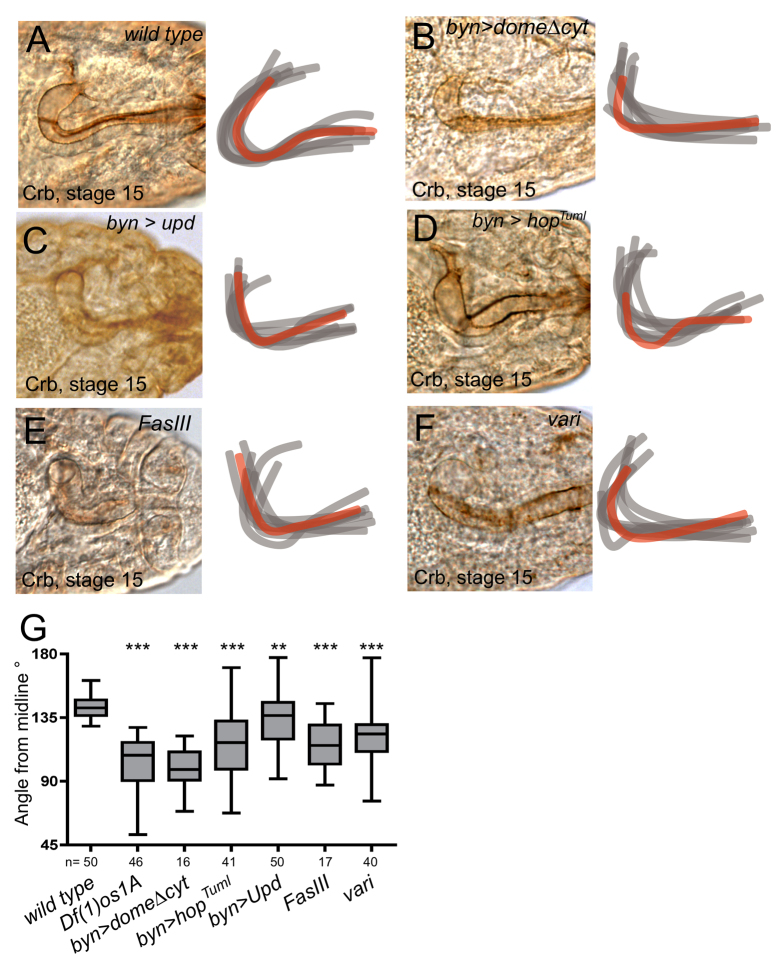
Fig. 2.
Disruption of hindgut curvature downstream of JAK/STAT signalling. Dorsal views of stage 15 gut lumens as visualised by Crumbs (Crb) expression. Hindguts pictured are shown as red overlays. (A-F) Representative images of the indicated genotypes with overlays of eight hindgut traces. (G) Box plot of stage 15 hindgut angles in the indicated genetic backgrounds. Number of samples measured for each genotype are shown. Box represents 25th to 75th percentile; line represents the median; whiskers represent min/max values. ***P<0.0001, **P<0.001.

