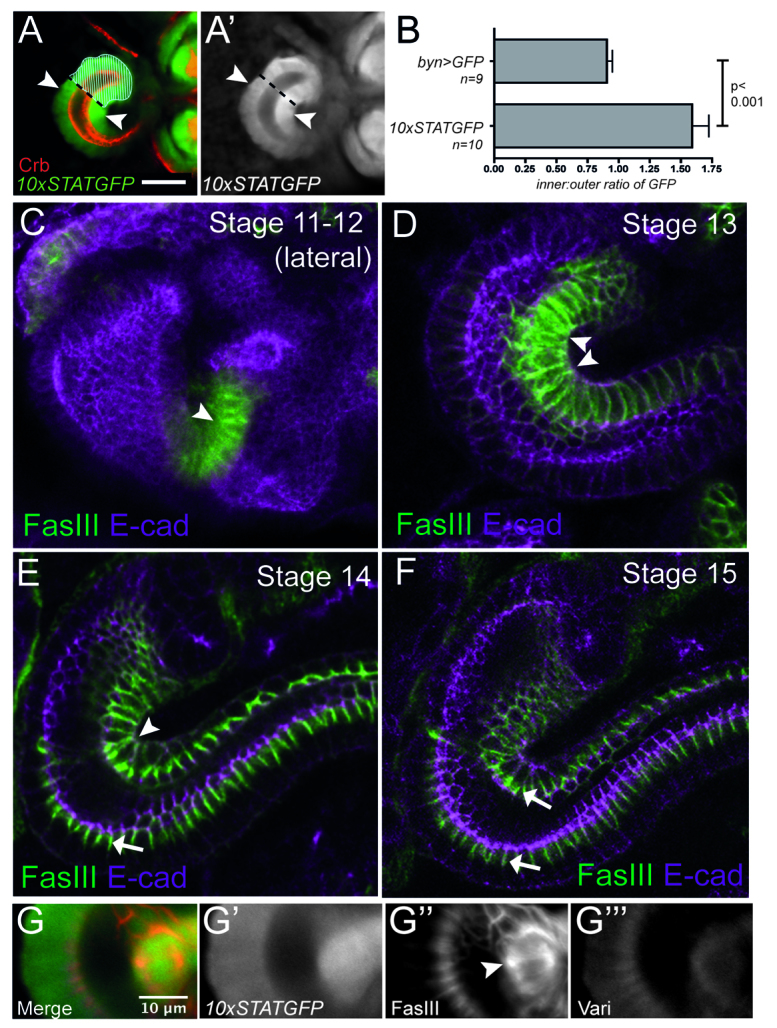
Fig. 3.

Asymmetry of JAK/STAT signalling and FasIII. Dorsal views of hindguts of the indicated stages. (A) 10xSTATGFP reporter and Crumbs (Crb) expression. Upd expression domain is marked by hashes. Reporter intensity was measured in cells (arrowheads) equidistant from the small intestine-large intestine boundary (dashed black line). Scale bar: 30 μm. (B) Quantification of 10xSTATGFP levels on opposite sides of the hindgut compared with the same points in controls expressing GFP uniformly (byn >GFP). Fluorescence is shown as a ratio of inner:outer intensity. Error bars represent s.e.m. (C-F) Time course of FasIII expression (green) within the developing hindgut counterstained with the adherens junction marker E-cad (magenta). View is lateral at stage 11-12 (C) and dorsal in subsequent stages. FasIII expression is restricted to the inside of the hindgut curve in C,D and is located along the entire lateral margin of the cells (arrowheads). Septate junctional FasIII (basal to E-cad) is detected from stage 14 (E,F, arrows). (G-G′′) Lateralised FasIII (G′, red in merge) on the inside of the hindgut curve overlying the region of higher 10xSTAT-GFP reporter activity (G′, green in merge) and Varicose (G′′, blue in merge) expression.
