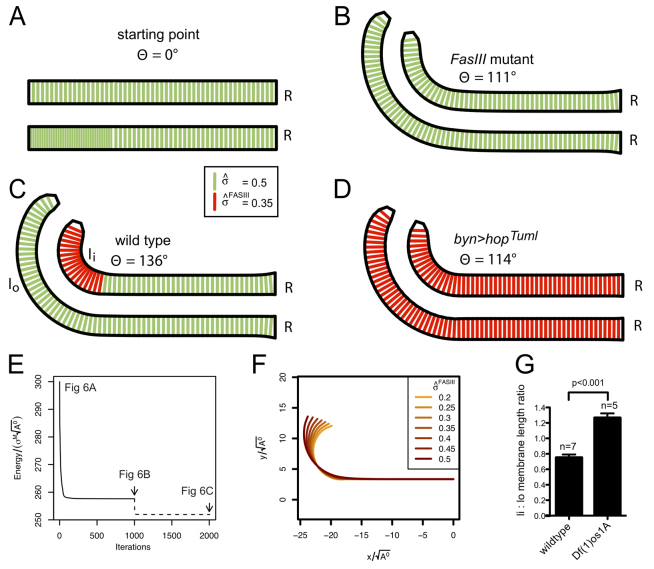
Fig. 6.
Modelling FasIII-induced adhesion in the hindgut. Two-dimensional representations of the stage 15 Drosophila hindgut showing lateral membranes (green). Vertices in contact with the rectum (R) are fixed during all of the simulations. (A) Initial topology of hindgut structure. (B) Surface energy minimised hindgut model for σ̂ = 0.5 representing the FasIII mutant condition. The angle with respect to the midline is 111°. (C) The effect of lateralised FasIII (red membranes) in 18 red lateral membranes where σ̂FasIII = 0.35. The angle with respect to the midline increases to 136°; also note the increase in the length of the lateral membranes of cells on the inside of the curve (li) relative to the outside of the curve (lo). (D) Simulation of uniformly lateralised FasIII (σ̂FasIII = 0.35). Angle with respect to the midline is now 114°. (E) Energy functions of the hindgut structures shown in A-C after 1000 successive iterations of the conjugate gradient method. The energy axis is dimensionless as energy is scaled by σM
 . (F) Tracks showing the change in the morphology of the hindgut over the range 0.2 ≤ σ̂FasIII ≤ 0.5. (G) Ratio of lateral membrane length on the inside:outside (li:lo) of wild-type and Df(1)os1A embryos. Error bars represent s.e.m.

