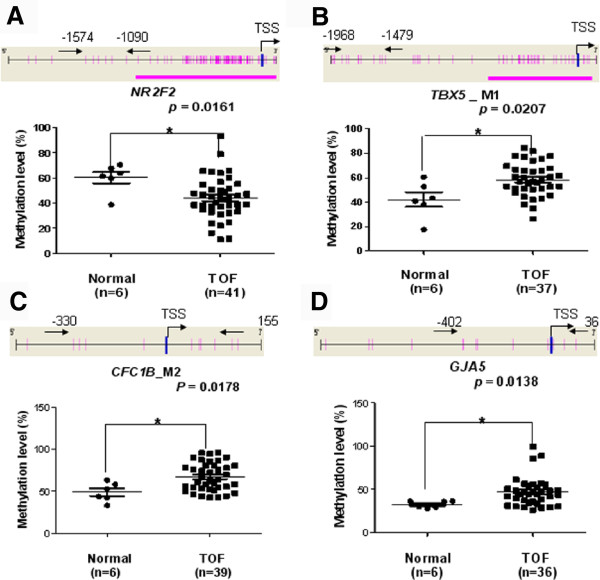
Figure 2.
Median methylation levels in the promoter CpG island shores and the promoter region located outside of the CpG island but near the TSS between TOF cases and controls. (A)NR2F2 median methylation level; (B)TBX5 median methylation level; (C)CFC1B median methylation level; (D)GJA5 median methylation level; TSS, Transcription Start Sites; red vertical line, CpG sites; red thick bars, CpG islands; The region between two arrows, target amplicon. *P < 0.05, **P < 0.01, ***P < 0.001 (Mann–Whitney test).

