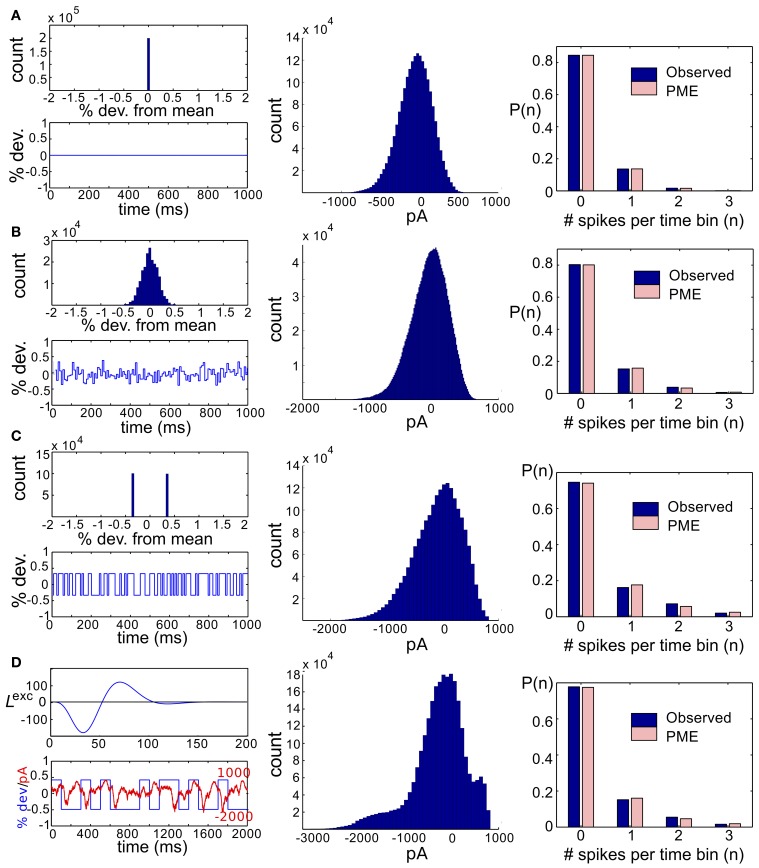
Figure 2.
Results for RGC simulations with constant light and full-field flicker. (A–C) (Left) A histogram and time series of stimulus, (center) a histogram of excitatory conductances and (right) the resulting distribution of spiking patterns. Stimuli are shown as deviations from a baseline intensity, expressed as a fraction of the baseline. Right panels show the probability distribution on spiking patterns P obtained from simulation (“Observed”; dark blue), and the corresponding pairwise approximation (“PME”; light pink). Each row gives these results for a different stimulus condition. (A) No stimulus (Gaussian noise only). (B) Gaussian input, standard deviation 1/6, refresh rate 8 ms. (C) Binary input, standard deviation 1/3, refresh rate 8 ms. (D) Binary input, standard deviation 1/3, refresh rate 100 ms. For panel (D), the data in the left panel differs. (Left, top panel) The excitatory filter Lexc(t) (Equation 7) is shown instead of a stimulus histogram; (Left, bottom panel) the normalized excitatory conductance, as a function of time (red dashed line), is superimposed on the stimulus (blue solid). (Center) The histogram of excitatory conductances and (right) the resulting distribution of spiking patterns. Both the form of the filter and the conductance trace illustrate that the LN model that processes light input acts as a (time-shifted) high pass filter.

