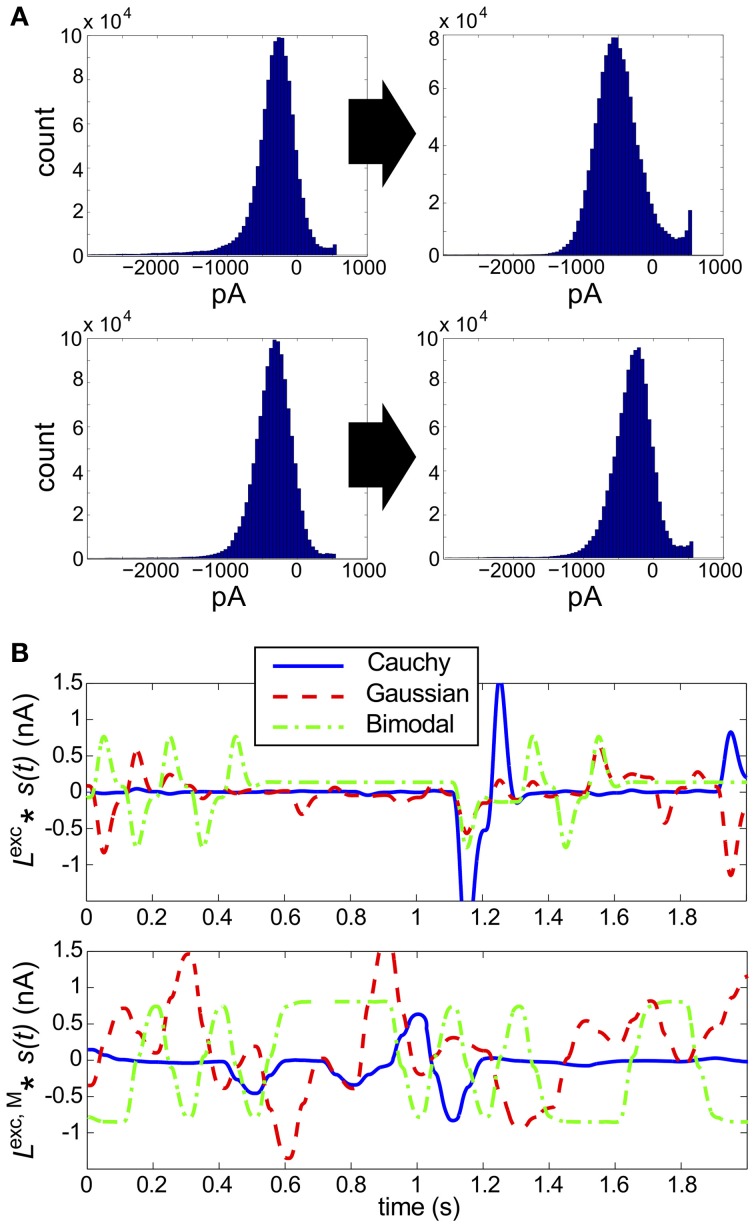
Figure 6.
Results for RGC simulations with heavy-tailed inputs. (A) Histograms of excitatory conductances, for the original (left) vs. monophasic (right) filter. The marginal statistics are heavy-tailed skew (top) and Cauchy (bottom) inputs, and refresh rate is 40 ms for both panels. The input standard deviation (expressed as a fraction of baseline light intensity) was 1/2 for both simulations. (B) Sample 100 ms stimuli, filtered by the original linear filter Lexc (top) and altered, monophasic filter Lexc,M(bottom). Cauchy (blue solid), Gaussian (red dashed), and bimodal (green dash-dotted) stimuli are shown.

