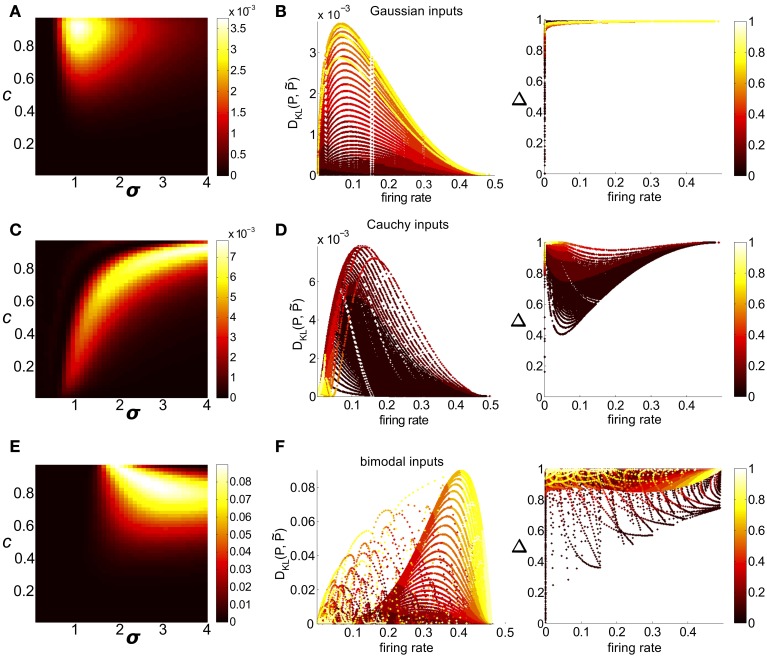
Figure 7.
Strength of higher-order interactions produced by the threshold model as input parameters vary, and the relationship of these higher-order interactions with other output firing statistics. (A) For Gaussian common inputs: DKL(P, ) as a function of input correlation c and input standard deviation σ, for a fixed threshold Θ = 1.5. Color indicates DKL(P, ); see color bar for range. (B) For Gaussian common inputs: DKL(P, ) vs. firing rate (Left) and the fraction of multi-information (Δ) captured by the PME model vs. firing rate (Right). Each dot represents the value obtained from a single choice of the input parameters c, σ, and Θ; input parameters were varied over a broad range as described in section 2. Firing rate is defined as the probability of a spike occurring per cell per random draw of the sum-and-threshold model, as defined in Equation (16). Color indicates output correlation coefficient ρ ranging from black for ρ ∈ (0, 0.1), to white for ρ ∈ (0.9, 1), as illustrated in the color bars. (C,D): as in (A,B), but for Cauchy common inputs. (E,F): as in (A,B), but for bimodal common inputs.

