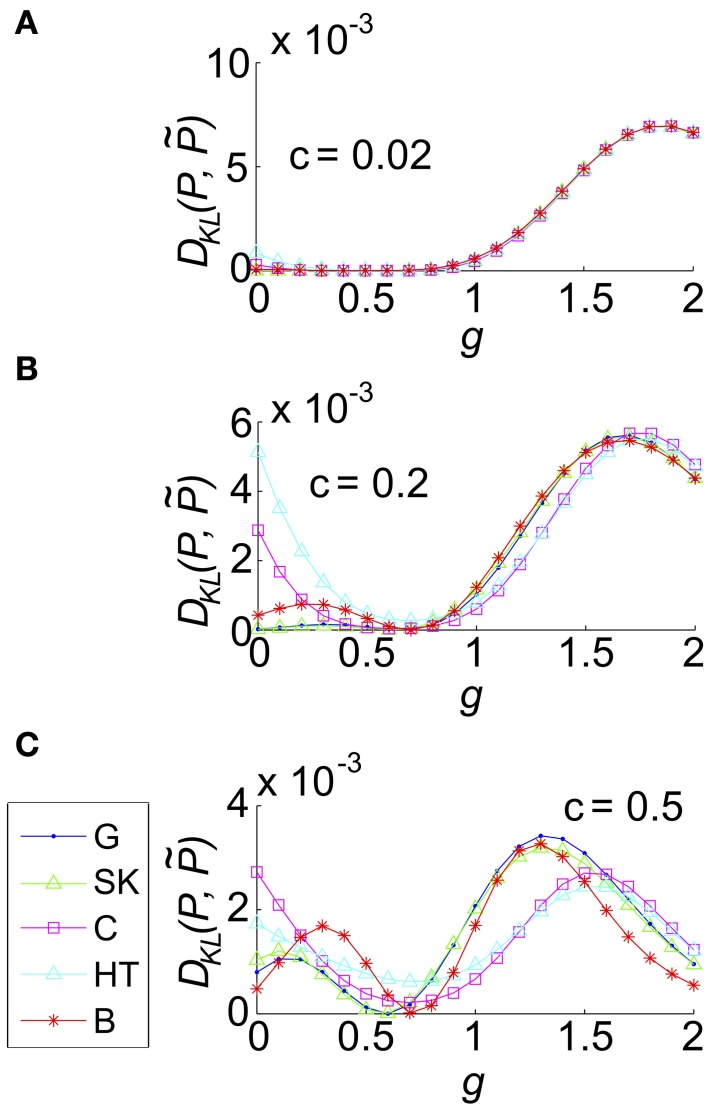
Figure 8.
The impact of recurrent coupling on the three-cell sum-and-threshold model. Each plot shows DKL(P, ) as a function of g, for a specific value of the correlation coefficient. In all panels, input standard deviation σ = 1, threshold Θ = 1.5, N = 3 and symbols are as described in the legend for (C). Abbreviations in the legend denote the marginal distribution of the common input: G, Gaussian; SK, skewed; C, Cauchy; HT, heavy-tailed skewed; B, bimodal. (A) For input correlation c = 0.02, (B) c = 0.2, and (C) c = 0.5.

