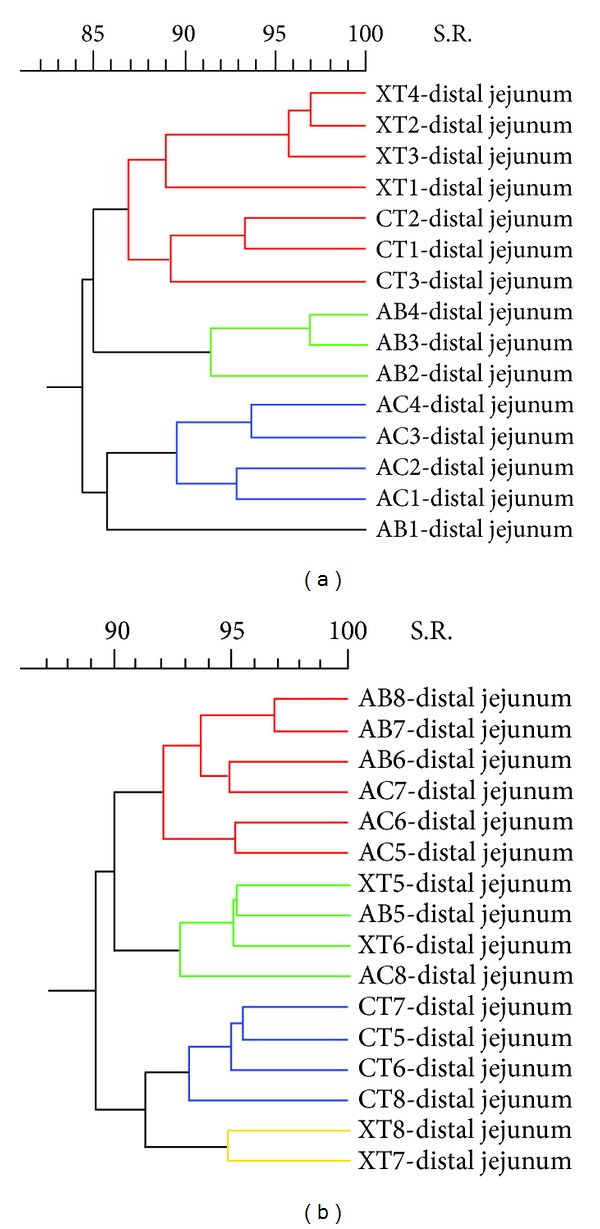
Figure 7.

Ecological changes in microbial population in distal jejunum. Dendrograms show the percentage of similarity of the band patterns when comparing the four experimental diets for the animals sacrificed on day 19 (a) and for the animals sacrificed on day 21 (b). The experimental diets are indicated as control diet (CT) or the same diet with 0.04% avilamycin (AB), 0.3% sodium butyrate (AC), or 0.03% plant extract mixture (XT). The pig identification numbers are indicated for each sample.
