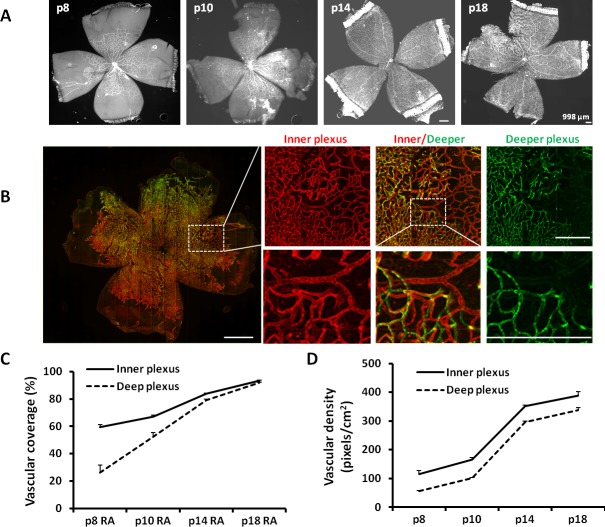
Figure 1.
Retinal vascular coverage and density in the inner and deeper plexi are increased during development at p8, p10, p14, and p18 in RA. (A) Syncroscan images of lectin-stained retinal flat mounts. (B) A portion of p18 VEGFA.shRNA-treated flat mount in the ROP model showing inner plexus, deep plexus, and combined image of both plexi assigned different colors (inner-red, deep-green; inner and deep plexi offset to permit visualization; lines indicate magnification size at the same unit). (C) Vascular coverage determined by vascular area normalized to total retina area. (D) Vascular density determined by the number of pixels of lectin fluorescence normalized to total retinal area (overall one-way ANOVA ***P < 0.001; results are means ± SD).

