
Figure 5.
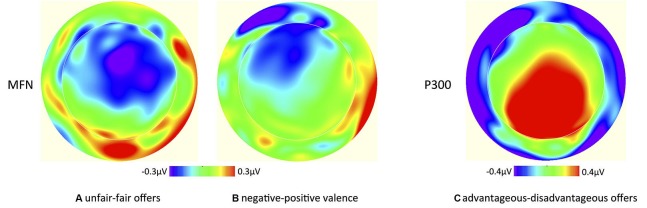
Scalp potential topographies of the average voltage differences between (A) unfair and fair offers and (B) negative and positive partner description for the MFN, and between (C) advantageous and disadvantageous offers for the P300.
Official websites use .gov
A
.gov website belongs to an official
government organization in the United States.
Secure .gov websites use HTTPS
A lock (
) or https:// means you've safely
connected to the .gov website. Share sensitive
information only on official, secure websites.
Scalp potential topographies of the average voltage differences between (A) unfair and fair offers and (B) negative and positive partner description for the MFN, and between (C) advantageous and disadvantageous offers for the P300.