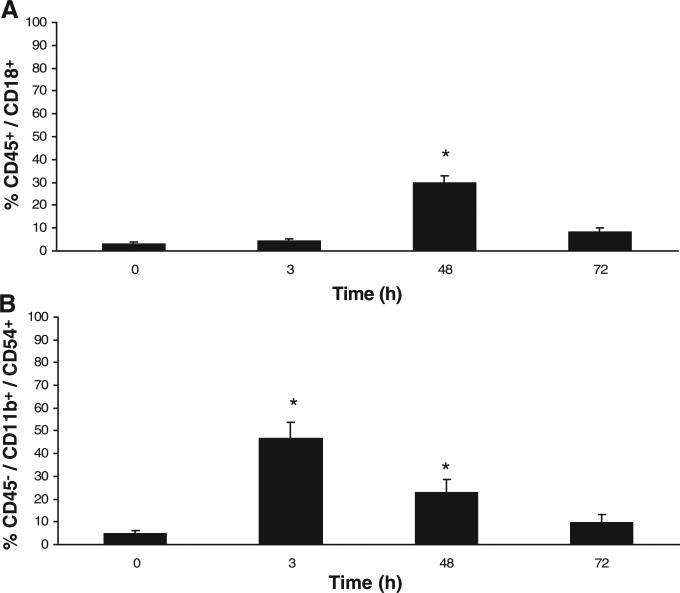
Fig. 7.
Flow cytometric immunophenotyping of blood and microglial isolates after CIP. A: CD18 (lymphocyte function-associated antigen-1) expression on CD45-positive cells (leukocytes) in blood at 48 h compared with control (0 h) shows a significant increase (P < 0.01). B: CD54 (ICAM-1) expression in microglial isolates (CD45low/CD11 b/chigh) at 3 and 48 h compared with control (0 h) shows a significant increase (P < 0.01). Each bar represents means ± SE. (n = 3/time point). *Significant difference from control (P < 0.05).

