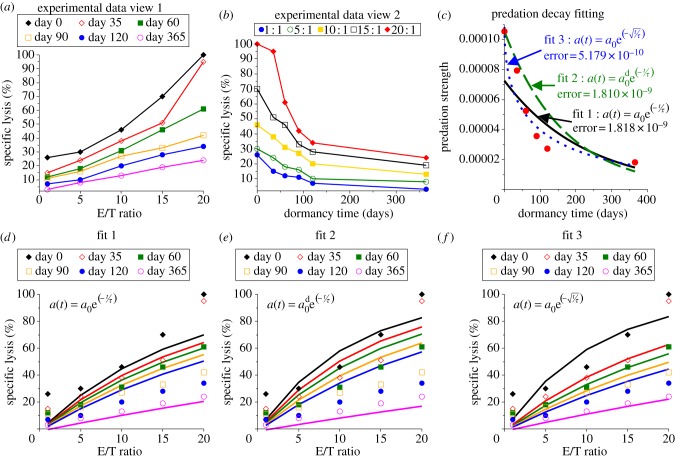
Figure 1.
Immune cytotoxicity assay data and model fits for predation decay after 0, 35, 60, 90, 120 or 365 days in dormancy. (a) Experimental specific lysis assay data published by Saudemont & Quesnel [9] (figure 2e) show predation efficacy after various days in dormancy as a function of the effector–target (immune–cancer) cell ratio, and (b) another view of these data that shows the decay of each effector–target ratio with time in dormancy. (c) The predation efficacy parameter a0 was estimated using our MCMC algorithm and the experimental data at each time point, resulting in the values indicated by the red dots. Three fits for the decay of predation efficacy were then estimated by least squares fitting. Fit 1 is an exponential decay, fit 2 is an exponential decay but the initial value (day 0) is matched to the day 0 data estimate a0d = a0, and fit 3 is a modified exponential decay. (d–f) The simulated cytotoxic assays assuming the predation decays according to fit 1, 2 or 3.

