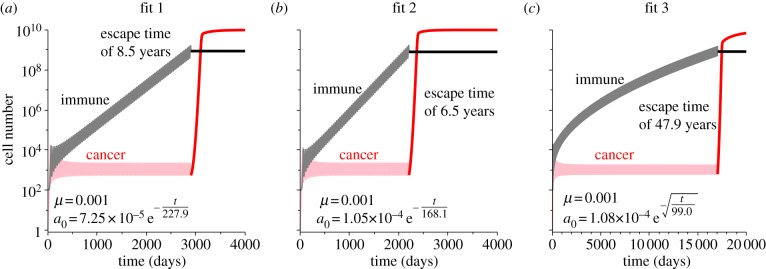
Figure 4.

Population growth curves assuming the three fits in predation decay and that the immune response is limited. In all simulations, once the mean value over one oscillation of the immune response is greater than 109 cells, our theoretical limit, it is forced to be constant. After this occurs, the cancer can escape the dormant state owing to the continuing decay in predation efficacy. Escape times for each fit are indicated in the plots. Fit 1 in (a), fit 2 in (b) and fit 3 in (c).
