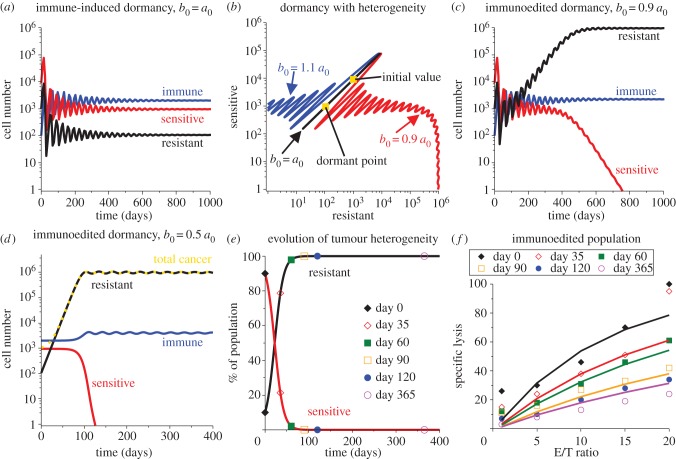
Figure 7.
The transition of a heterogeneous cancer population to a mostly homogeneous but resistant population can explain the observed decline in predation efficacy. Induction of the dormant state for the heterogeneous population (90% sensitive and 10% resistant cancer cells) is shown in (a) and cancer heterogeneity is shown via the phase portrait in (b). The dormant state from (a) is represented by the black diagonal line in (b) indicated by b0 = a0. As time increases, the composition is represented by a point on the line that oscillates up and down, starting at the initial composition point, (R, C) = (103, 9 × 10³), and tending towards the dormant state value of (R, C) = (106, 950). From this curve, if b0 is increased, so that b0 > a0 contrary to the ‘resistant’ definition, then the resistant population is eliminated leaving the sensitive population in immune-induced dormancy (blue curve). But, if b0 is decreased, so that b0 < a0, then the resistant population is less sensitive to immune predation and so grows to a larger but still dormant size. This larger population causes the sensitive population to be eliminated through contact inhibition (red curve). The time-evolution of this process for b0 = 0.9a0 is shown in (c). To match the experimental data, we also simulate this process with b0 = 0.5a0 (d) and show the transition of the population composition in (e). Taking the composition at the corresponding time points and simulating a lysis assay with this composition gives the specific lysis curves shown in (f) overlaid with the experimental data from Saudemont & Quesnel [9].

