
Figure 15.
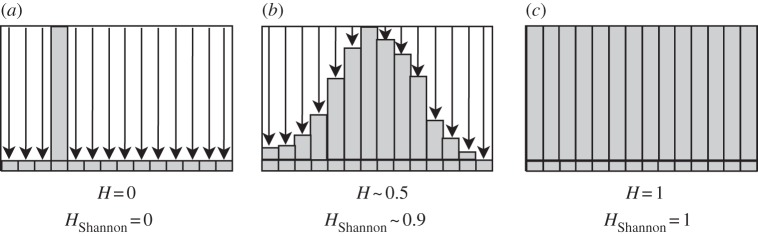
An illustration of the heterogeneity index as calculated via equation (A 1), and with the Shannon index from the frequency distribution of trait values. If all cells in the population have the same trait value, we get a minimum heterogeneity index (a). If the population has an equal spread of trait values throughout the range, the heterogeneity index is maximum (c). The two values differ in the configuration shown in (b), where the Shannon index grows logarithmically compared with the linear growth used here.