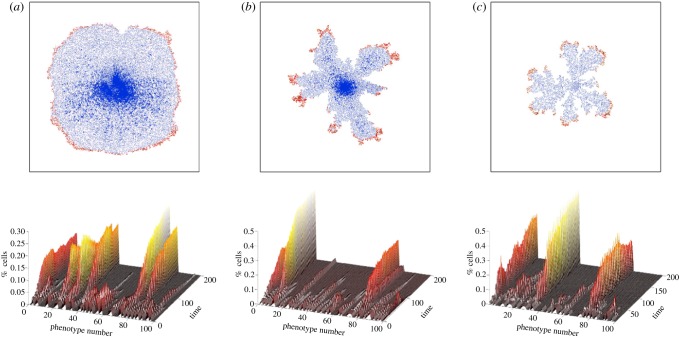
Figure 5.
Simulation results from the HDC model under three different microenvironments: (a) uniform ECM, (b) grainy ECM and (c) low nutrient. The upper row shows the resulting tumour cell distributions obtained after three months of simulated growth; we can see that the three different microenvironments have produced distinct tumour morphologies. The lower row shows the relative abundance of a possible 100 tumour phenotypes over time as the tumour invaded each of the different microenvironments. We note that there are approximately six dominant phenotypes in the uniform tumour, two in the grainy and three in the low nutrient tumour. These phenotypes have several traits in common: low cell–cell adhesion, short proliferation age and high migration coefficients. In each tumour, one of the phenotypes is the most aggressive and also the most abundant, particularly in (b) and (c). All parameters used in the simulations are identical with the exception of the different microenvironments.

