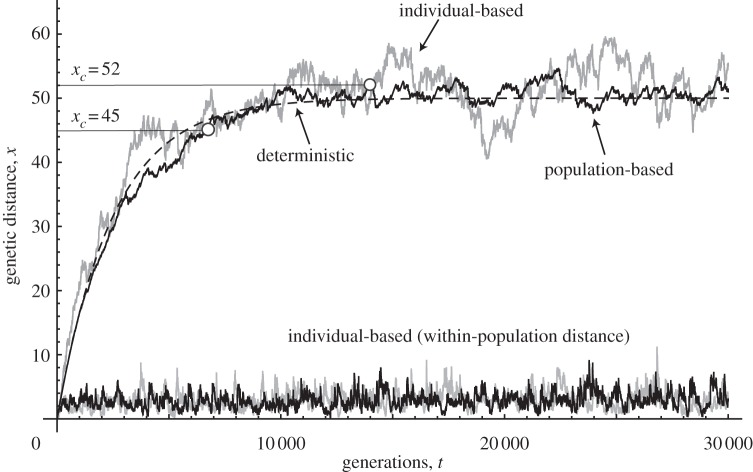
Figure 1.
Dynamics in the genetic distance (average genetic distance) between two populations in each model. The horizontal axis is time expressed in terms of the number of generations. The dashed line corresponds to the deterministic model. Regarding the two lines with oscillations along the dashed line (upper part of the figure), the black jagged line corresponds to the population-based simulation and the grey jagged line represents the individual-based simulation. The other two lines near the horizontal axis (black and grey) correspond to genetic distances within a subpopulation in the individual-based simulation. Two different threshold levels are indicated by the horizontal lines. Open circles indicate the time to speciation. Parameters are N = 100, k = 0.01, μ = 0.0001, l = 100, m = 0.01 and ɛ = 0.01.

