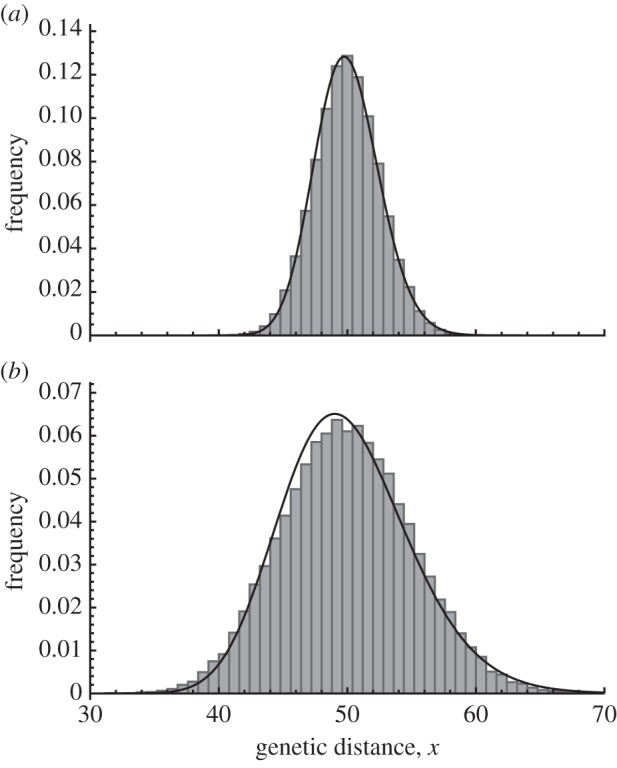
Figure 2.

Stationary distribution of genetic distance with two parameter sets. The horizontal axes are genetic distance and the vertical axes are its frequency at equilibrium. The histograms show the results of simulations with the population-based model, with 50 000 samples of genetic distance per simulation. The solid black lines show solutions from the diffusion approximation to the model. Parameters are (a) k = 0.01, l = 100, m = 0.01 and ɛ = 0.01 and (b) k = 0.01, l = 100, m = 0.0025 and ɛ = 0.04.
