Figure 5.
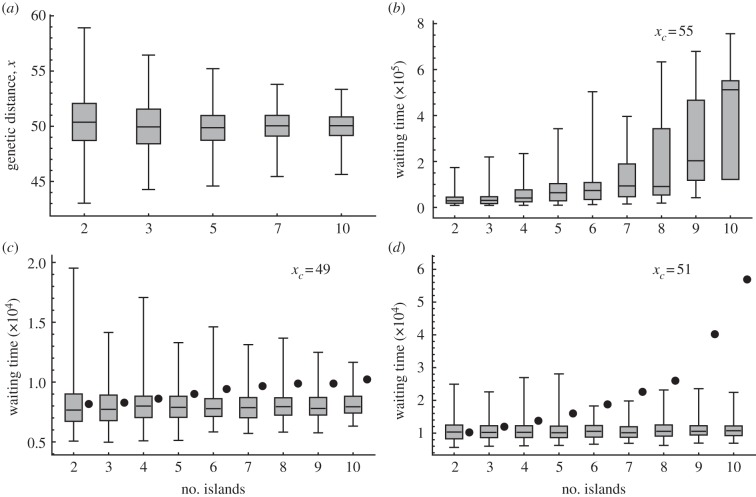
The horizontal axes are the number of islands. The following data come from population-based simulations with parameters k = 0.01, l = 100, m = 0.01 and ɛ = 0.01. The bold horizontal line in each box is the median and the top and bottom of the box are one quartile above and below the median, respectively. The whiskers extend to the most extreme data within the simulation range. (a) Box-plots showing genetic distance between two populations at equilibrium (100 000 samples in each). (b) Waiting time until the first genetic distance reaches the threshold xc = 55 from an initial genetic distance of x0 = 0. This corresponds to the situation in which (a) has a threshold of xc = 55. Each distribution was created from 200 samples. Average waiting times to first speciation, indicated by filled circles, from 100 samples when the threshold was (c) xc = 49 and (d) xc = 51. Box-plots show distributions of waiting time, as in (b).

