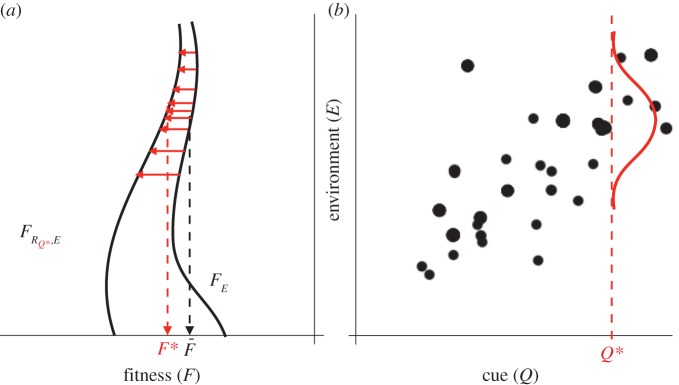
Figure 1.

(a,b) From cue to fitness increment. An example (completely hypothetical) of how a cue (Q) may give information about the environment (E) and thus yield an increased fitness  , where the expected fitness of an uninformed individual is
  . The curve drawn in (b) gives the conditional distribution of the environmental value given a cue Q*. The curves in (a) depict fitness with and without the optimum response (to Q*) to the variation in the environment. The figure illustrates that having correct information about the environment is sometimes more important (here, the difference between
  and FE is the largest for low values of E) than at other times (here, high values of E). Given the covariance, the cue therefore conveys more biological information at low values than at high values. (Online version in colour.)
