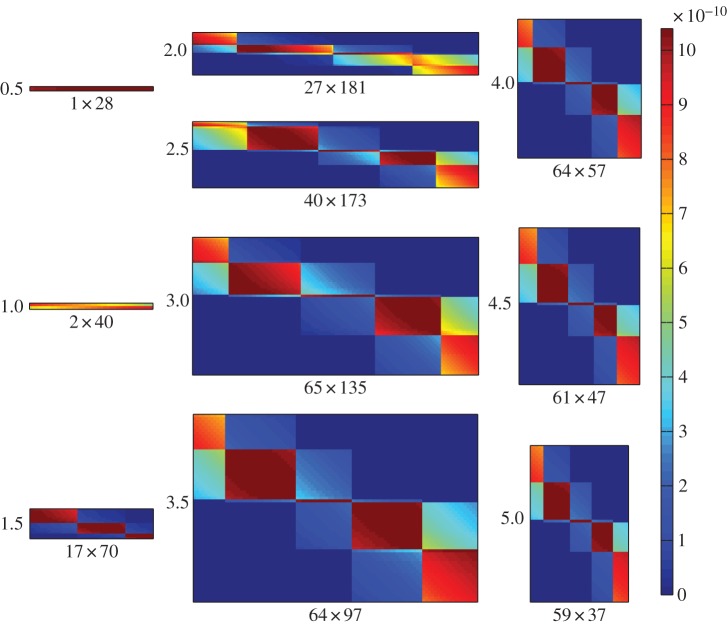
Figure 4.
Coevolutionary formation of the adsorption rate interaction network over time. Shading shows pairwise interaction strength (ϕθij) for bacterial strains (rows) and phage strains (columns). Network size (number of bacterial strains × number of phage strains) is shown as the x-axis label for each plot; time point (×107 min) is shown as the y-axis label. Plots show time points corresponding to the dotted gridlines shown in figure 2, with time increasing down each column, from top left to bottom right.

