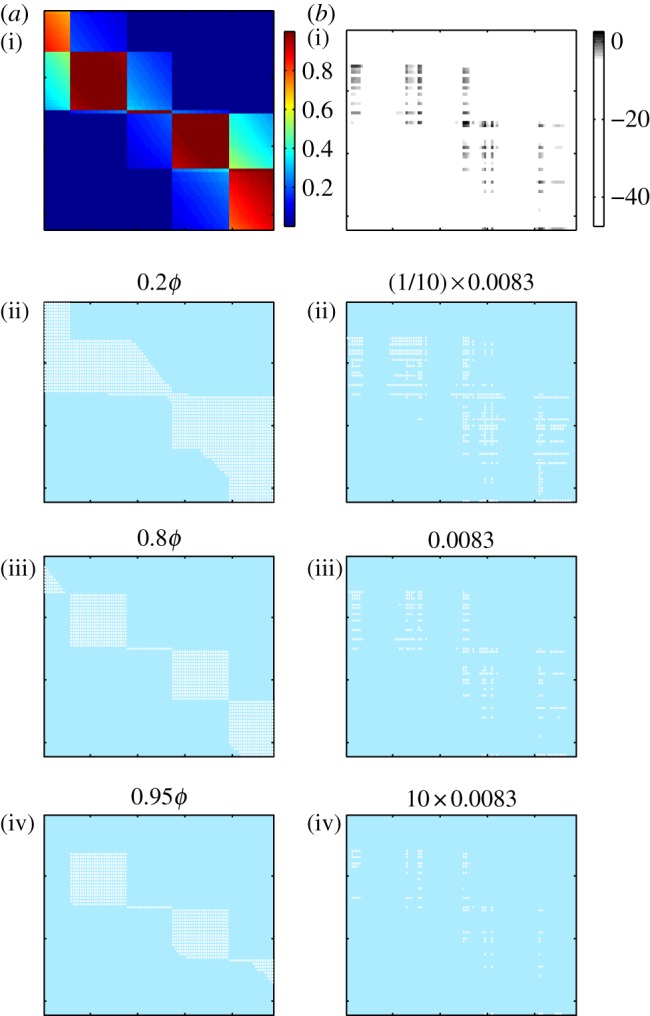
Figure 6.

Effect of the choice of filter threshold on the binary representation of interaction matrices. (a(i),b(i)) shows the raw (unfiltered) matrix data for pairwise adsorption rates (a) and infection rates (b). (a(ii)–(iv),b(ii)–(iv)) show binary matrices formed by filtering raw data with different thresholds. Threshold values of 0.8ϕ for adsorption rates and 0.0083 cells (ml min)−1 for infection rates were used for all subsequent analyses.
