Figure 7.

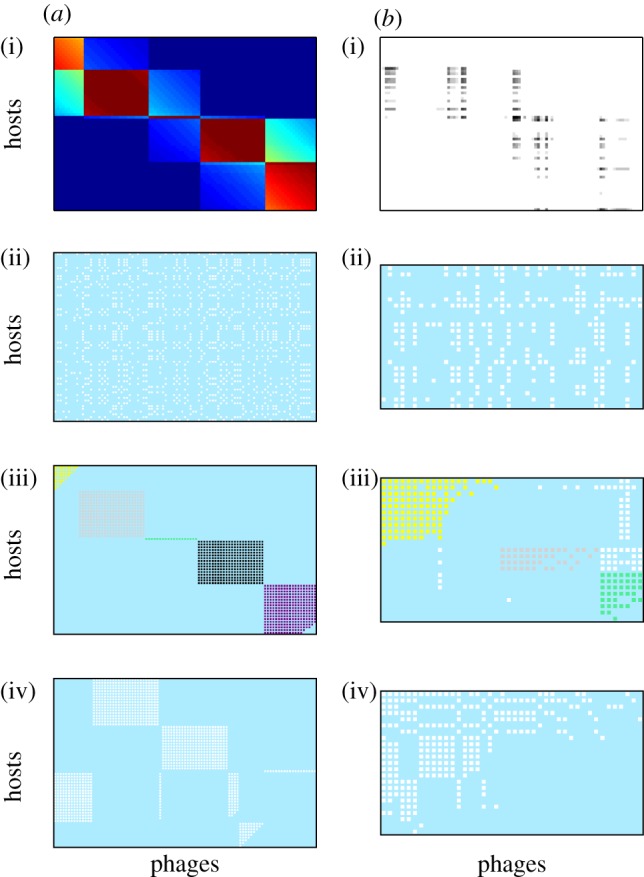
Comparison of binary interaction networks formed by applying a threshold filter to (a) adsorption rate and (b) infection rate matrices, for a snapshot of the system at t = 3.5 × 10⁷ min, arranged with host strains on rows and phage strains in columns. (a(i),b(i)) Quantitative interaction data; (a(ii)–(iv),b(ii)–(iv)) binary matrices formed using a threshold filter of the quantitative data, sorted for (a(ii),b(ii)) random permutation, (a(iii),b(iii)) maximization of modularity and (a(iv),b(iv)) maximization of nestedness.
