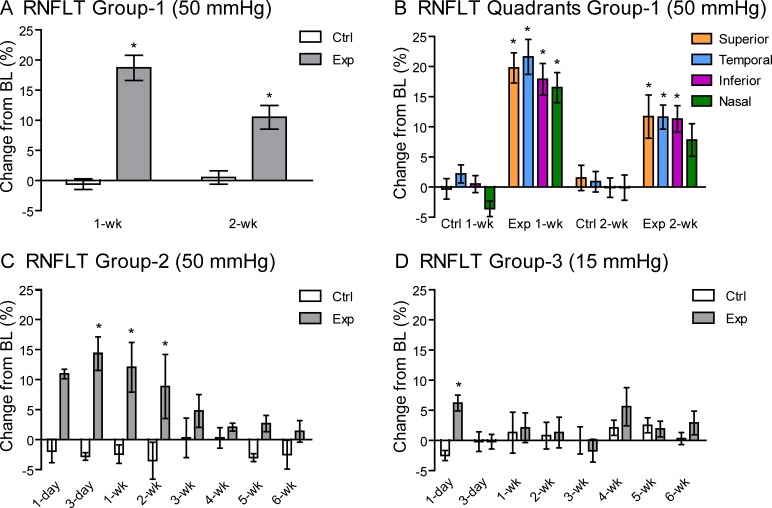
Figure 2.
Percentage change in RNFLT at follow-up time points relative to baseline (BL) for each group of experimental (Exp) and fellow control (Ctrl) eyes. (A) Group 1 (50 mm Hg) rats show an increase in RNFLT at both the 1-week (n = 28) and 2-week (n = 15) follow-up in the experimental eyes but not in their fellow control eyes. (B) The change in peripapillary RNFLT for group 1 eyes from baseline was similar across superior, temporal, inferior, and nasal quadrants at both the 1-week (P = 0.11) and 2-week (P = 0.62) follow-up. (C) Data from group 2 with a 6-week follow-up (50 mm Hg [n = 4]) show that the increase in RNFLT is transient, recovering to baseline by the 3-week follow-up, with a peak observed at 3 days and no loss evident at 6 weeks. (D) Data from group 3 with a 6-week follow-up (sham, 15 mm Hg [n = 4]) show a smaller, transient increase in RNFLT in the experimental eyes at the 1-day follow-up only. Error bars denote ±SEM. *P < 0.05 (Bonferroni post hoc test).

