Figure 6.

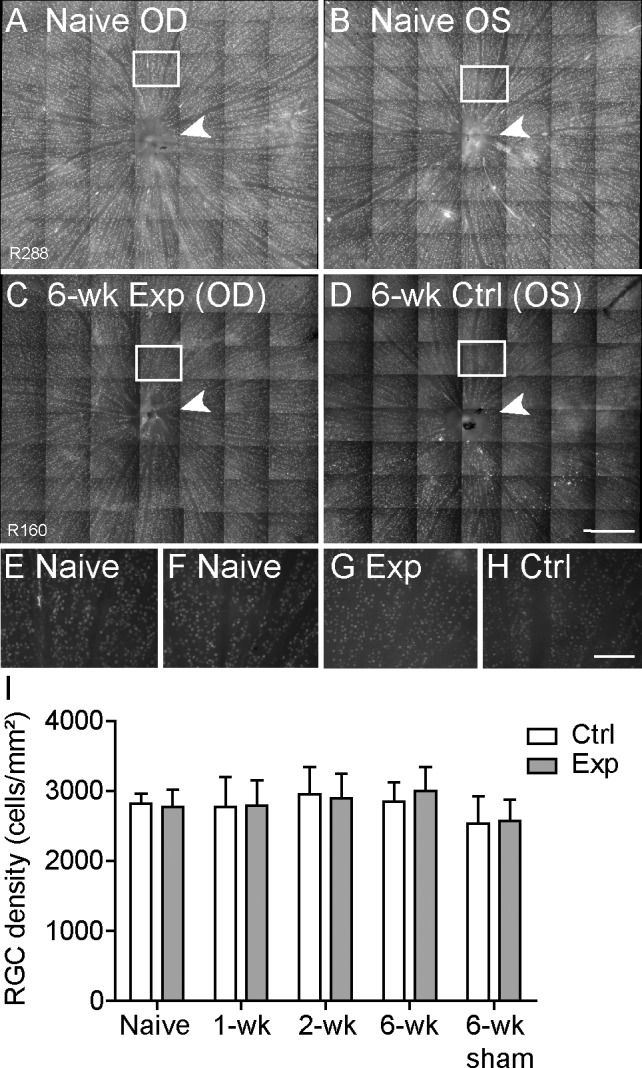
Density of Brn3a-labeled RGCs across 8.1 ± 1.0 mm2 of central retina. (A–D) Representative example of RGC somas seen in a montage of micrographs (×20) from right (A) and left (B) naive normal retinas and in experimental (C) and fellow control (D) retinas from a group 2 rat sacrificed 6 weeks after the IOP elevation episode. Arrowheads indicate the optic disc. (E–H) Higher-resolution micrographs from boxed regions in (A–D) are shown in (E–H), respectively. (I) Quantification of RGC density for experimental (Exp) and fellow control (Ctrl) eyes from rats sacrificed 1 and 2 weeks (group 1 [n = 9 and n = 11, respectively]) and 6 weeks (group 2 [n = 4]) after IOP elevation to 50 mm Hg for 8 hours, along with rats sacrificed 6 weeks (group 3 [n = 4]) after sham cannulation to 15 mm Hg for 8 hours and naive normal rats (group 4 [n = 5]). There was no loss of RGCs in experimental eyes relative to fellow control eyes (P = 0.74) or between groups (P = 0.34). Error bars = SEM. Scale bars: 0.5 mm (A–D); 100 μm (E–H).
